Hyperliquid Rockets as Monero and Bittensor Face Critical Reversals Near Key Resistance
Amidst a backdrop of fast-paced markets, Hyperliquid’s astonishing 70% surge to monthly highs at $44 catches the eye, signaling a potentially significant breakout phase. Meanwhile, Monero and Bittensor find themselves at critical junctures after recent gains, stalling near pivotal resistance levels. As Hyperliquid pushes against upper limits, traders are left to ponder whether Monero and Bittensor can sustain their upward momentum or falter. Let’s take a closer look at the signals behind these moves.
Hyperliquid (HYPE) Price Analysis
| Crypto | Close | 1W% | 1M% | RSI | ADX | MACD | CCI 20 |
|---|---|---|---|---|---|---|---|
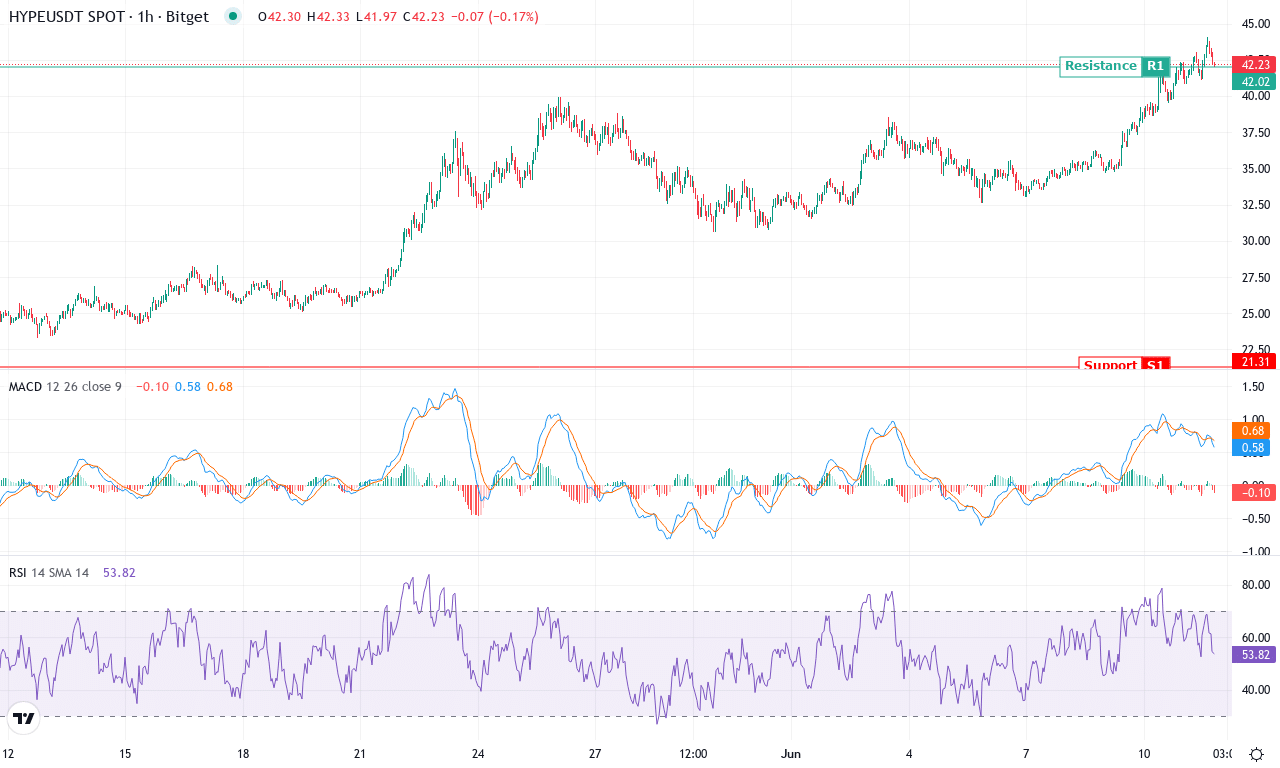
| HYPERLIQUID(HYPE) | $42.35 | 17.41% | 70.42% | 73.1 | 43.3 | 3.20 | 221.32 |
After a blistering month, Hyperliquid is commanding the spotlight with an astonishing 70% surge, vaulting it to fresh monthly highs near $44. This comes on the heels of a jaw-dropping 221% rally over the past three months and a staggering 1,594% return in six months—momentum like this doesn’t show up every cycle. The weekly performance remains robust as well, up over 17%, which signals not just fleeting interest but sustained accumulation. Technical outlook suggests HYPE is in hyper-growth mode, relentlessly pressing against upper resistance. Still, with price action hugging the previous monthly highs, I’m watching—if bulls clear $44, we could easily see a volatility surge and new discovery levels.
Diving deeper into the structure, trend indicators are screaming strength: the ADX is firmly elevated, showing this move has real backbone, while positive directional movement is far outstripping bearish pressure. Momentum oscillators reinforce this: not only is the MACD expanding with a widening gap above its signal line, but the Awesome Oscillator remains solidly positive, highlighting swelling bullish momentum. All moving averages—short and long—are stacked beneath price, which is classic breakout structure. On the flip side, RSI is climbing toward overbought territory. When RSI noses above 70, caution rises; at these heights, sharp profit-taking and programmatic liquidations are common. If sellers step in around $44, look for support first at the recent pivot near $34.50 and then around $30—any slip below those could trigger a steeper correction. But all signs point to bulls in control. If a blue-sky breakout comes, I’d be thrilled to ride this rocket with you—just keep one eye on the exits when mania strikes.
Monero (XMR) Price Analysis
| Crypto | Close | 1W% | 1M% | RSI | ADX | MACD | CCI 20 |
|---|---|---|---|---|---|---|---|
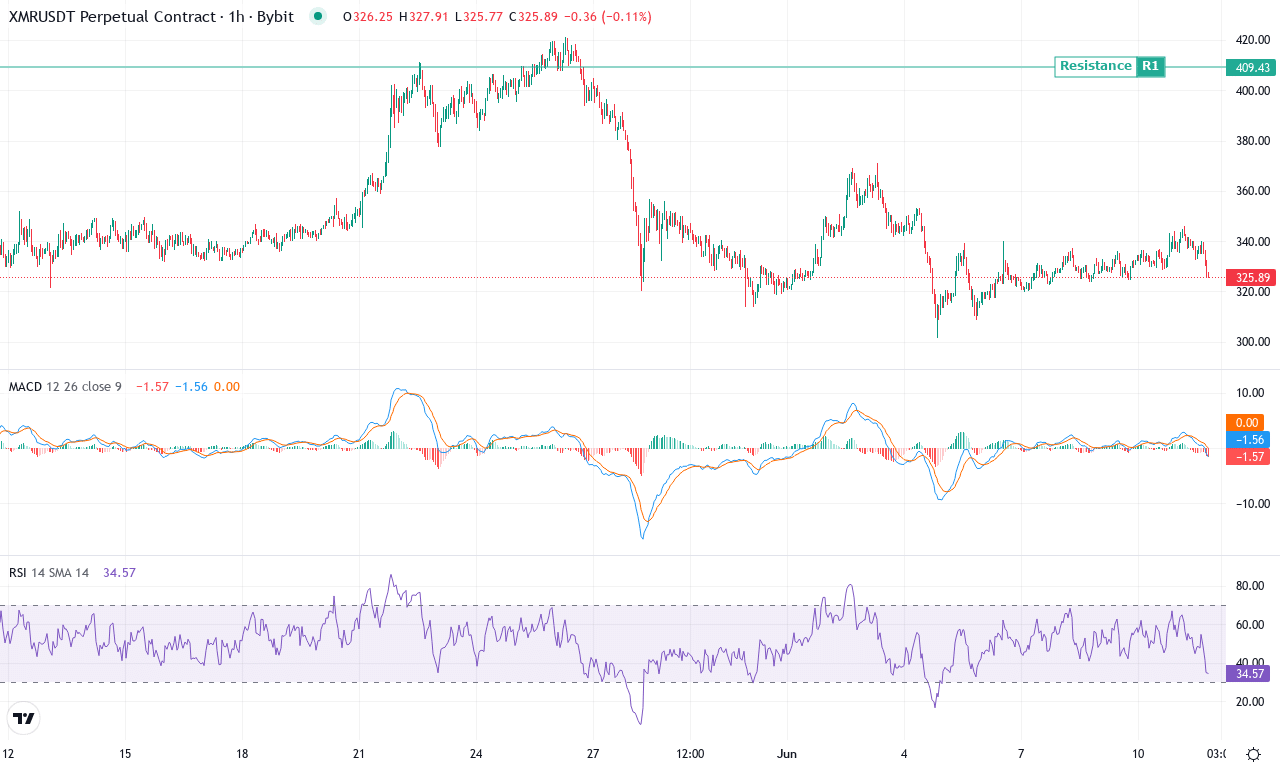
| MONERO(XMR) | $326.38 | -5.22% | -1.65% | 46.9 | 26.3 | -0.68 | -47.47 |
After a strong multi-month run that saw Monero surge over 56% in the past three months and more than 63% in six months, the privacy-focused coin is now enduring a noticeable cooldown. This week’s sharp 5% pullback has Monero trading around $326, close to the monthly midpoint but well beneath last month’s $421 peak. The technical outlook suggests waning bullish momentum—an unsurprising pause given the magnitude of recent gains, but nonetheless a point of caution. With buyers unable to defend higher levels and the broader market risk-off, it feels like Monero’s uptrend is at a critical inflection point. As a trader, I’ll admit: the drama here is palpable—Monero bulls have gotten used to winning, but the next move could flip sentiment on its head.
Diving into the technicals, oscillators are start to roll over, with the weekly MACD crossing back toward its signal line—hinting at loss of upside momentum. Trend indicators remain constructive overall, but the gap between positive and negative DI lines is narrowing, and the average directional index (ADX) shows trend stamina may be fading. RSI’s recent retreat, coupled with stalling moving averages near the current price, adds evidence of exhaustion. The $337–$340 area now marks resistance, with a surge above likely triggering a fresh chase toward $410, then $420. However, failure to reclaim those levels—and especially a decisive break below weekly support around $300—could open the door to a steep correction, possibly back toward the $260 zone. If bears seize control here, risks of an extended fall rise sharply. Personally, if $300 fails, that’s my signal to step aside and let the dust settle—never forget, discipline trumps hope in tough markets.
Bittensor (TAO) Price Analysis
| Crypto | Close | 1W% | 1M% | RSI | ADX | MACD | CCI 20 |
|---|---|---|---|---|---|---|---|
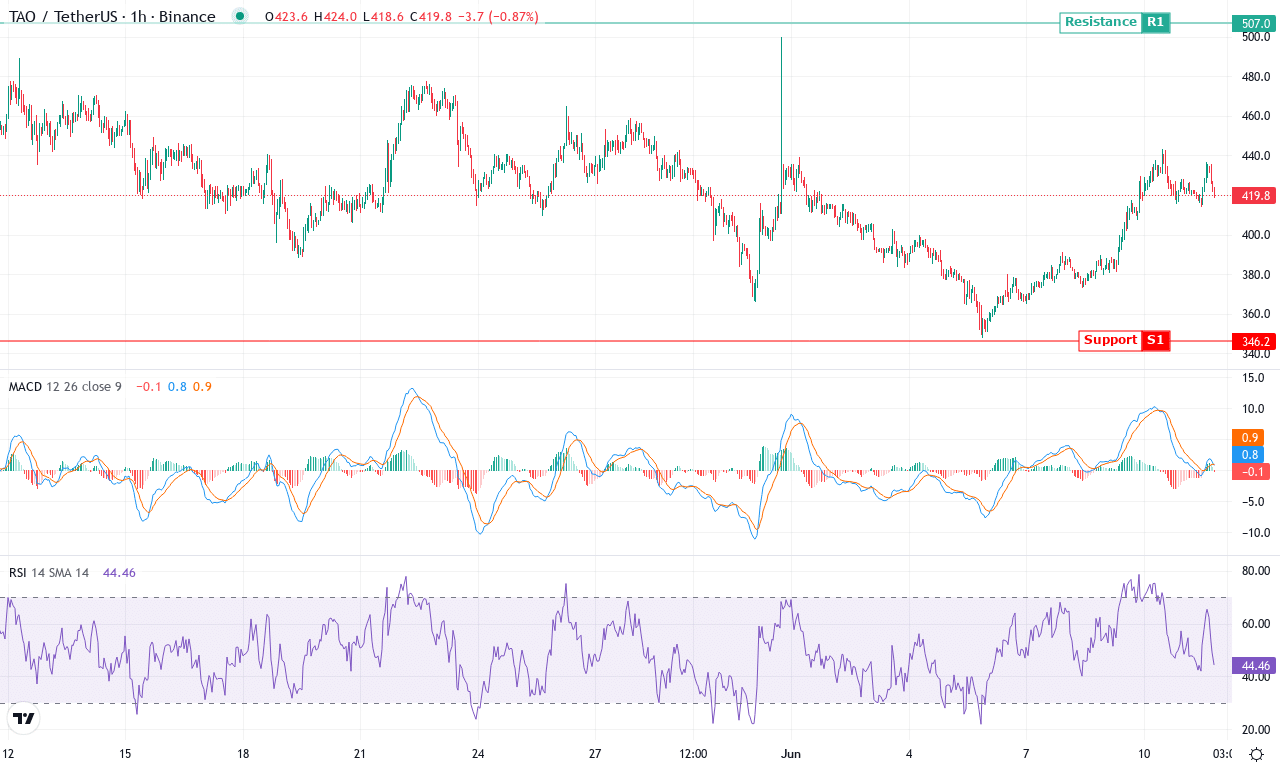
| BITTENSOR(TAO) | $424.20 | 9.70% | -7.54% | 54.7 | 18.5 | 0.17 | 40.81 |
After a month rife with dramatic swings, Bittensor (TAO) is settling just below its recent highs at $424.2, having surged an eye-catching 63% over the past three months before stalling with a sharp 7.5% weekly drawdown. This recent volatility comes on the heels of a steeper 26% six-month correction and underscores a market searching for direction against an impressive 23% yearly return. Interestingly, Bittensor’s bounce off June’s $347.4 low puts the token in striking distance of key resistance at $500, but traders have reason for caution: profit-taking is escalating as prices approach psychologically significant round numbers. I’m tracking buyers’ commitment closely—another push higher could reignite breakout momentum, but a failure here would confirm recent gains as nothing more than a bear market rally.
Technically, trend indicators reveal a remarkable surge in underlying strength: the ADX remains elevated, while positive directional movement far outweighs negative, signaling that bulls retain control for now. However, momentum oscillators show conflicting cues—the weekly MACD is flattening and even crossing beneath its signal line, and the RSI hovers near overbought territory, raising the likelihood of a short-term pullback. Price action analysis finds TAO sandwiched between its 10- and 50-day exponential moving averages, offering traders a gauge for near-term support (EMA50 at $389.87) and resistance (monthly high at $500). The next act is clear: if bulls clear $500 with conviction, expect a run toward $583 as marked by classic pivot levels; but should sellers overwhelm the tape, look for a retracement toward the pivotal $347 zone. Personally, I’d be thrilled to see a strong close above $500—but until then, I’m keeping stops tight and watching for signs of trend exhaustion. Stay nimble; Bittensor’s next major move may arrive fast and with little warning.
The Next Moves for Key Altcoins
As Hyperliquid remains buoyant at its new peak, all eyes are on Monero and Bittensor as they hover near resistance thresholds. Sustained momentum or a decisive breakout from these levels could propel these coins further, but any faltering may prompt a retracement to support. Traders should remain vigilant for cues that indicate whether these resistances will hold or allow for a breakthrough.