Hyperliquid, Story, and Injective Spiral as Key Supports Buckle—Is a Panic Capitulation or Reversal Near?
In the ever-evolving world of crypto, Hyperliquid, Story, and Injective find themselves at critical junctions. Spurred by drastic market shifts, these assets now hover near pivotal support levels, as recent plunges cast doubt on their previously bullish trajectories. With intense volatility as a backdrop, traders are weighed with the dilemma: could this be a chance for panic capitulation, or is a reversal brewing on the horizon? Let’s break down what the key indicators are suggesting now.
Hyperliquid (HYPE) Price Analysis
| Crypto | Close | 1W% | 1M% | RSI | ADX | MACD | CCI 20 | HYPERLIQUID(HYPE) | $40.32 | -10.64% | -24.90% | 41.8 | 32.6 | -2.38 | -84.01 |
|---|
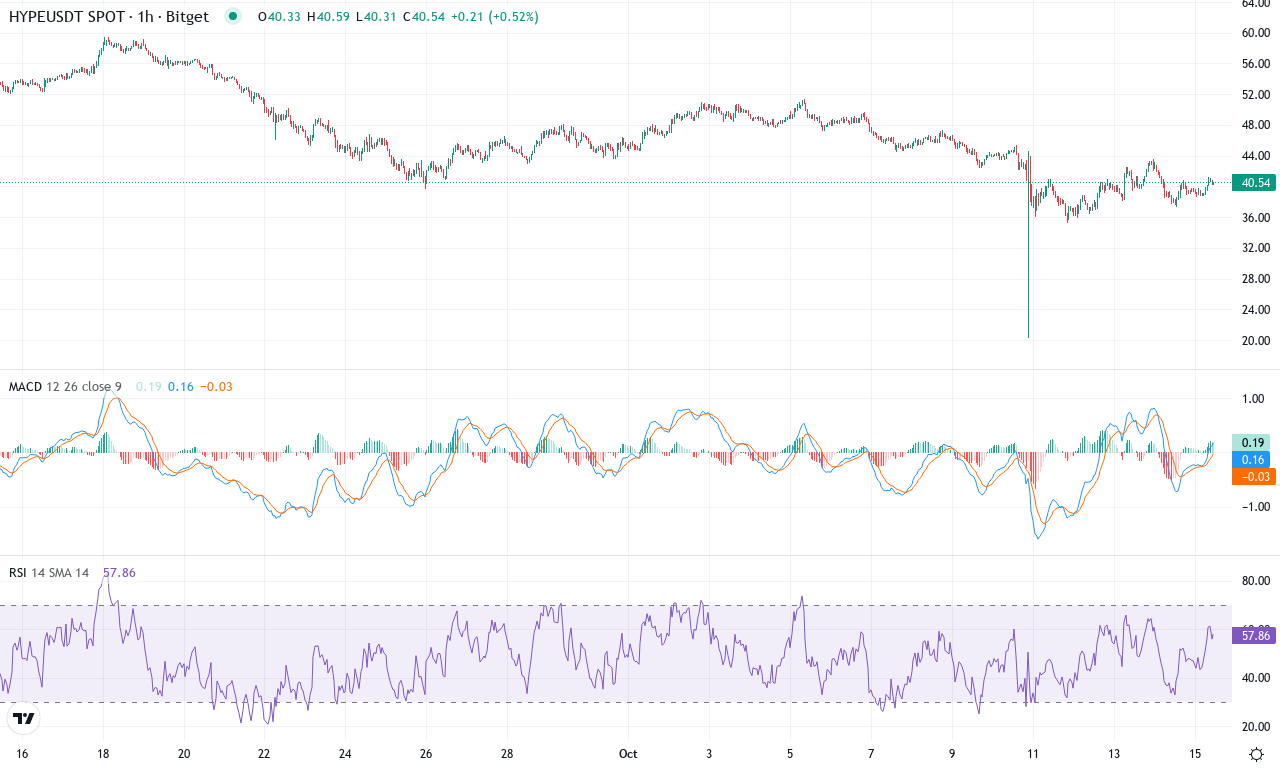
After a blistering multi-month ascent, Hyperliquid has abruptly shifted gears, plunging by nearly 25% over the past month and closing this week at $40.32. Just weeks removed from a fresh all-time high above $59, sellers have seized control, forcing a dramatic retreat to the lower end of the recent trading range. The high volatility reflects uncertainty: traders are torn between locking in huge 6-month gains—up over 130%!—and trying to catch the next big bounce. The technical backdrop is tense right now: that reversal from highs is underscored by a flood of bearish momentum, snapping the previously bullish narrative cold. My gut says caution is warranted; if Hyperliquid breaches its monthly low near $21, risks of an extended fall escalate fast.
Beneath the surface, trend indicators confirm the shift. The ADX signals strong trend intensity, but the negative directional component now dominates, suggesting sellers are firmly in charge. Momentum oscillators also point south—MACD lines have crossed bearishly and widened, and the histogram confirms downside acceleration. The RSI has cooled off from overbought extremes, but with readings still just below fifty, there’s room for more unwinding if panic takes hold. Price action is clustered well below the 10- and 20-day EMAs, reinforcing that short-term sentiment remains defensive. Immediate support sits near $36.80—watch this level closely. If bulls can reclaim $48, we may see quick relief up to $56, where heavier resistance and old profit-takers likely wait. But ignore the doom: this much volatility often means opportunity strikes just as sentiment reaches extremes. As always, stay nimble and ruthless with stops—I’ll be watching for a flush or sudden snapback rally with equal anticipation.
Story (IP) Price Analysis
| Crypto | Close | 1W% | 1M% | RSI | ADX | MACD | CCI 20 | STORY(IP) | $6.63 | -29.42% | -32.15% | 41.4 | 31.7 | -0.84 | -79.84 |
|---|
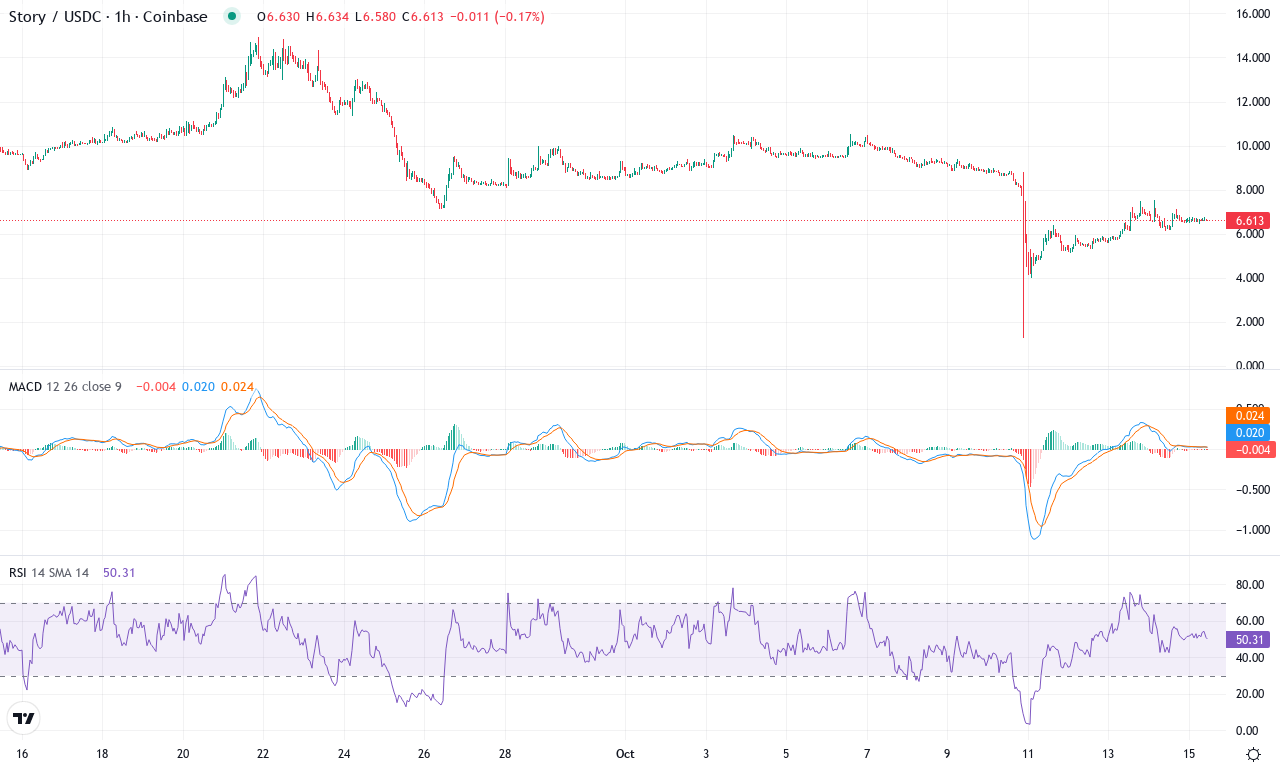
After a dramatic surge over the past three months, Story (IP) is now experiencing a sharp correction, with the price plummeting nearly 30% in just a week. That spectacular run—over 50% gains in three months and nearly 70% over six months—has flipped abruptly, catching late bulls off guard. The recent monthly high near $14.93 now seems a distant memory, as the price has collapsed to around $6.62, hovering just above key support levels. It’s a harsh reminder: when volatility surges and profit-taking sets in, momentum can pivot fast. The technical picture suggests that bears have seized short-term control, invalidating the previous breakout thesis and leaving traders warily eyeing further downside risks.
Technically, the trend indicators have switched from euphoria to caution. The ADX signals a strong trend, but with negative directional flows growing—the bears are clearly flexing their muscles. MACD has rolled over, with the line dipping below the signal and sliding into negative territory, while momentum and oscillators have turned sharply south. RSI now hovers just above the 40s, indicating cooling momentum but not yet outright oversold territory, while the price has crashed below all key moving averages including the EMA 20 and EMA 50. Watching the price action, the former support zone near $6.20 becomes critical; if sellers break this, the next target could be the monthly low at $1.25, a daunting fall. Conversely, a bounce from current levels could spark a relief rally up toward resistance at $10.30, though any rally might find stiff headwinds there. Personally, I’m on high alert—volatility creates opportunity, but discipline is paramount when downside risk is this elevated.
Injective (INJ) Price Analysis
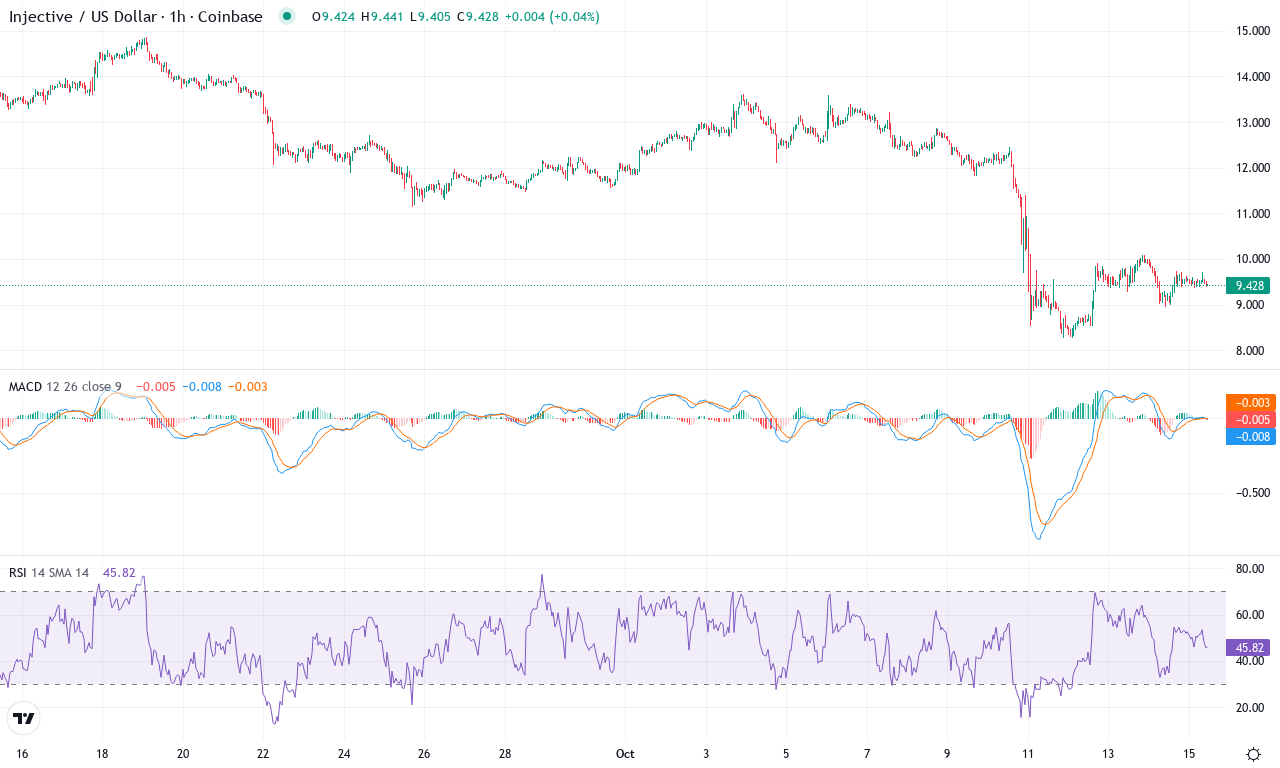
| Crypto | Close | 1W% | 1M% | RSI | ADX | MACD | CCI 20 | INJECTIVE(INJ) | $9.42 | -24.19% | -33.08% | 35.1 | 28.1 | -0.93 | -121.55 |
|---|
After a painful month for Injective, the token’s price has been battered by a relentless 33% slide, with the asset tumbling from highs near $15 to the $9.40 region. Short-term bulls have been largely washed out, as a sharp 24% weekly loss underscores the surge in volatility and intensified selling pressure. Notably, INJ is now hovering near its monthly lows, and the technical outlook suggests the recent rebound attempts are struggling to gain traction. As a trader, these kinds of punishing selloffs set my nerves on edge—momentum may still be in the bears’ favor until buyers decisively step in. With long-term performance metrics now deeply in the red, traders are asking the big question: Is capitulation at hand, or is Injective close to finding its feet for a recovery?
From a technical standpoint, trend indicators remain firmly negative, with oscillators flashing warning signs of continued bearish momentum. The average directional index reflects a strong trend, and the negative directional indicator sits notably above its positive counterpart—sellers are clearly dominating the field. The weekly MACD continues its downward drive, and while momentum has slowed, there’s scant evidence of an imminent bullish reversal. What troubles me most is that the price action is now well beneath all major short-term exponential moving averages, signaling that resistance is forming in the $10.50 to $12.50 zone. Psychological support is close to $9, but a failure to hold this threshold risks an extended fall toward $8.25, marking the next logical support. However, if bulls can stage a comeback and thrust INJ above $12.70, the path to $14 and beyond could open quickly—especially if short liquidations begin to unwind. Until then, caution is warranted—the pressure remains squarely on buyers to prove the tide has turned.
Is a Reversal in Sight?
Hyperliquid approaches its support, while Story remains precariously near its recent lows and Injective attempts stabilization. The test for traders is if these assets will break or hold, setting the stage for potential reversals. While unpredictability reigns, the subsequent price actions should provide clarity as to whether panic or recovery prevails.