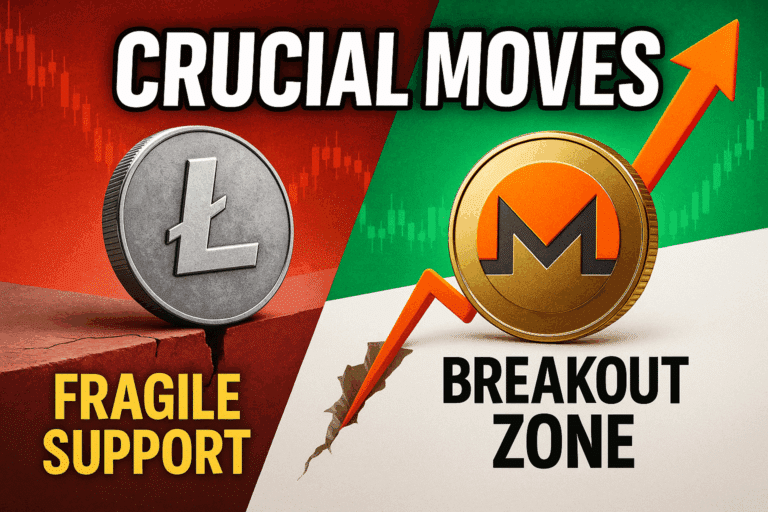
Litecoin And Monero Coil At Critical Levels As Bulls And Bears Plot Their Next Volatility Surge
Litecoin and Monero are teetering on pivotal levels, poised for their next volatility surge as market players brace for impact. Despite Litecoin’s 13% drop over the last month, bulls are eyeing the pivotal $100 ceiling, while Monero tempers its explosive rally with a cautious retreat. As these cryptocurrencies balance on the edge, will buying momentum roar back, or is a deeper correction lurking? Let’s take a closer look at the signals behind the move.
Litecoin (LTC) Price Analysis
| Crypto | Close | 1W% | 1M% | RSI | ADX | MACD | CCI 20 |
|---|---|---|---|---|---|---|---|
| LITECOIN (LTC) | $91.30 | 1.97% | -13.05% | 50.6 | 18.4 | -1.30 | 0.13 |
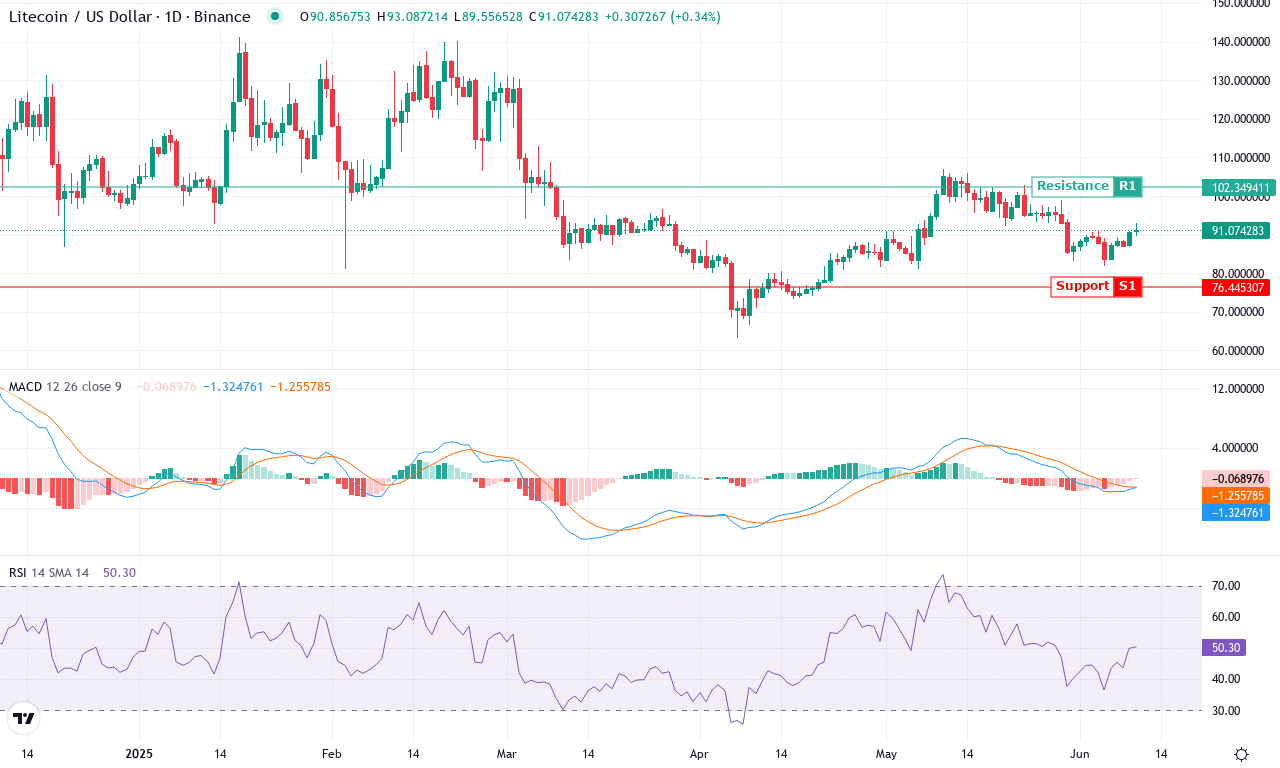
After a bruising month, Litecoin is struggling to regain its footing—the coin shed over 13% in the last 30 days, registering one of its steeper corrections this year despite clinging to double-digit annual gains. Intraday volatility has mellowed, but beneath the surface, trend indicators outline a battle between deteriorating bullish momentum and eager dip buyers. Litecoin failed to break above the psychologically important $100 mark, sliding back toward support near $82. The recent price action feels lethargic, almost like traders are holding their breath, awaiting a clear directional catalyst.
Diving into the technicals, the trend strength is softening—directional signals have shifted, with bearish momentum encroaching as sellers grab short-term control. The weekly MACD signals contraction, and oscillators confirm underlying exhaustion, flagged by a waning Awesome Oscillator and a neutral-to-weak momentum read. With Litecoin stuck just under its short- and medium-term moving averages, further upside looks constrained unless bulls stage a decisive push. Immediate support is anchored around $82—a break here risks an extended fall toward June’s lows. On the flip side, if buyers retake the initiative and clear resistance at $106, the next logical target would be the $120–$125 zone, which could draw in sidelined capital. Personally, I’d want to see a volume surge and break above $100 for conviction—otherwise, this sluggish sideways shuffle could persist a while longer. Stay sharp, as a volatility surge could break the stalemate any day now.
Monero (XMR) Price Analysis
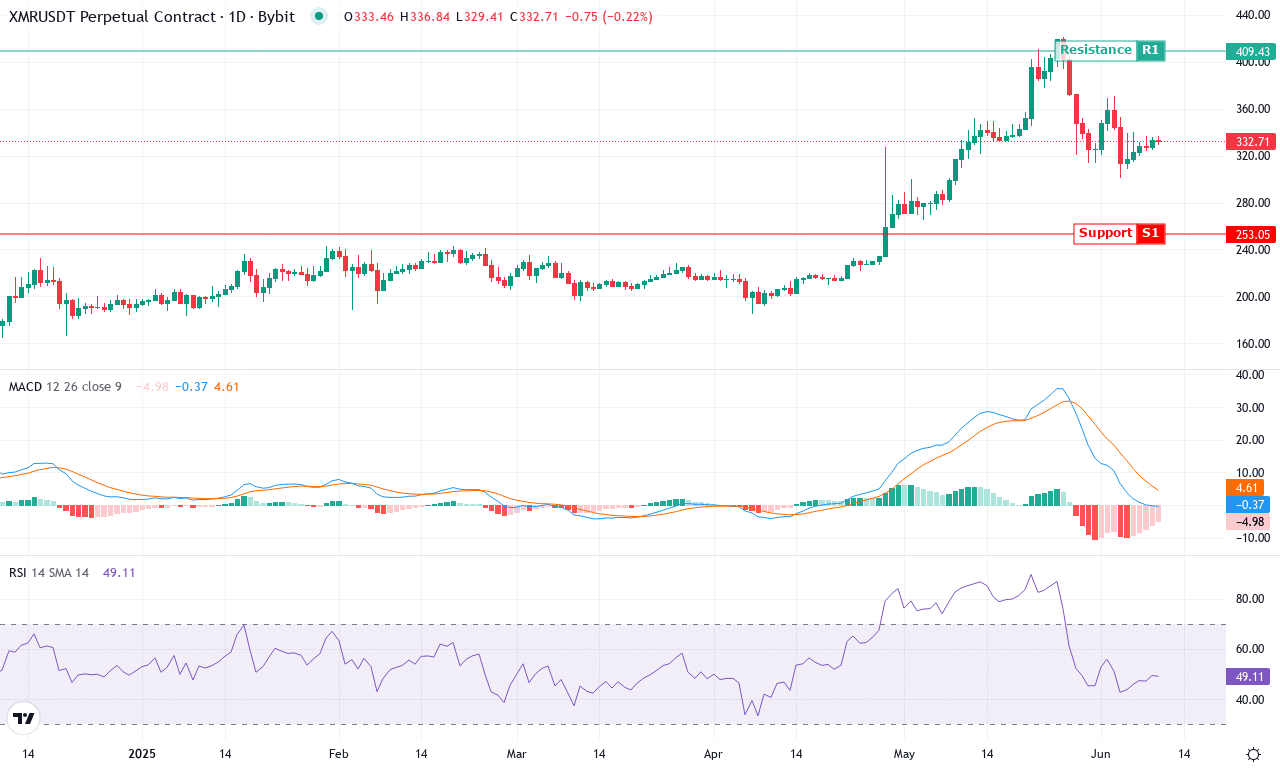
| Crypto | Close | 1W% | 1M% | RSI | ADX | MACD | CCI 20 |
|---|---|---|---|---|---|---|---|
| MONERO (XMR) | $333.80 | -6.95% | 2.51% | 49.5 | 28.4 | -0.31 | -49.00 |
After a multi-month surge that saw Monero climb more than 57% over the past quarter and notch a hefty 66% rally in the last six months, the privacy-focused coin is cooling its heels just below recent highs. This past week’s -7% dip stands out after such pronounced strength, hinting at profit-taking and some nerves among shorter-term holders. Still, Monero closed the month up—holding the line at $333.80, not far removed from its $421 high for June and comfortably above the $301 monthly low. The long-term trend is undeniably bullish, with price action consistently anchored above key exponential moving averages, and the yearly gain near 92% underscores persistent institutional demand. However, the mood is shifting as volatility returns and traders weigh the sustainability of this advance.
Technically, Monero’s trend remains robust, with the ADX clocking in at an elevated level, signaling that this uptrend hasn’t lost its torque just yet. Positive directional movement slightly trails the negative, suggesting bulls are consolidating rather than capitulating. However, overbought signals are simmering just beneath the surface: the RSI and multiple oscillators remain elevated, while the MACD has begun to flatten after weeks of acceleration—a classic sign that bullish momentum is cooling off. At this stage, the coin is camped above the $330 support zone, with the $410–$420 band acting as a key resistance barrier; a close above $420 could reignite breakout momentum and send Monero toward $490, while a failure here risks an extended fall back toward $285 support, especially if bearish divergences stack up. I’ll admit, I’m on my toes—breakout or breakdown, this chart is coiling for a bigger move. Stay vigilant: traders who ignore these pressure points do so at their own peril.
Anticipating the Next Move
Litecoin remains just under the critical $100 mark, hinting at either a breakout or further downward pressure if buyers fail to rally. Monero, after a robust ascent, shows signs of slowing momentum as it approaches stiff resistance. For traders, the immediate future lies in watching whether buying momentum can overcome these barriers—otherwise, a deeper correction might loom on the horizon.