Litecoin Avalanche And XRP Teeter At Critical Lows As Oversold Bounce Or Breakdown Beckons
In a market fraught with uncertainty, Litecoin, Avalanche, and XRP find themselves at a pivotal juncture, teasing traders with the possibility of volatility-fueled rallies or deeper declines. Recently, Litecoin has slipped 19% this month, coming dangerously close to its $80 support, while Avalanche is skating on thin ice, with a perilous 33% decline this month testing its resolve at $16.70. As these coins hover near critical lows, the technical setup suggests that the potential for an oversold bounce could counterbalance persistent bearish pressures. Will the bulls seize this opportunity, or are further capitulations on the horizon? Let’s take a closer look at the signals behind the move.
Litecoin (LTC) Price Analysis
| Crypto | Close | 1W% | 1M% | RSI | ADX | MACD | CCI 20 | LITECOIN(LTC) | $81.10 | -4.87% | -19.20% | 37.4 | 24.3 | -2.48 | -151.90 |
|---|
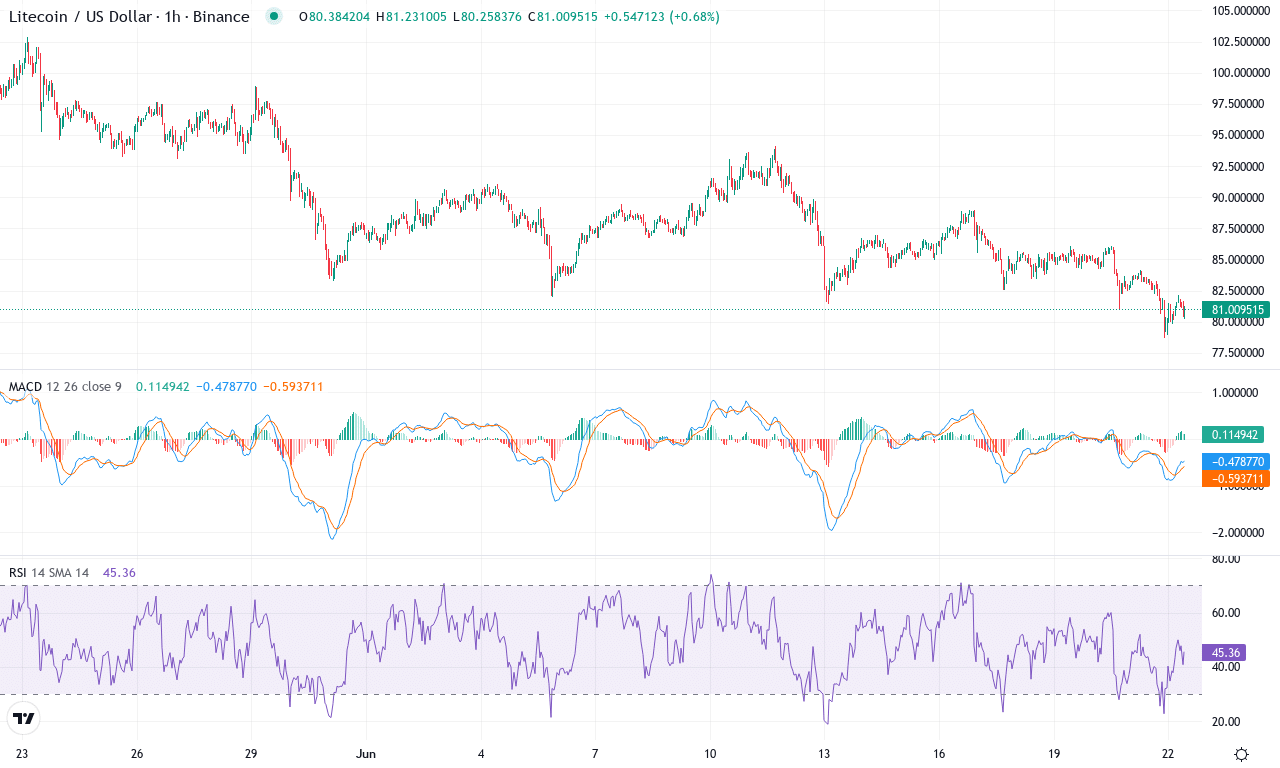
After a turbulent month marked by a steep 19% decline, Litecoin is catching traders’ eyes as it hovers just above recent lows. The relentless sell-off has driven LTC to underperform broader crypto benchmarks, sinking nearly 12% over the last three months and almost 24% since the start of the year. Yet, in this gloom, some faint hope emerges—the price is clinging to the psychologically critical $80 zone, just above its monthly low, where previous downturns have found buyers willing to defend the line. While the mood is undeniably bearish, seasoned traders know that exhaustion often breeds opportunity, especially when volatility surges and capitulation sets in. I’ll admit, after watching LTC get hammered, part of me wonders if an oversold snap-back is brewing beneath the surface.
Diving into the technical landscape, trend indicators are flashing warning signals—downside momentum remains entrenched, with oscillators and the weekly MACD stuck in negative territory. The ADX paints a portrait of robust trend strength, and with sellers holding the upper hand, a bearish reversal remains in play unless bulls regain control above mid-term moving averages, which are currently clustered well above spot prices. RSI and oscillators are approaching oversold regions, signaling that pressure could soon give way to a relief bounce, but so far, there’s scant evidence of reversal as moving averages slope downward and price remains capped beneath resistance at $92. The next critical support lies around $78; a dip below would risk an extended fall toward deeper lows. Conversely, if price action claws back above the $88–92 range—where both prior breakdowns and pivotal moving averages converge—even short-lived bullish momentum could drive a squeeze up to $100. For now, caution rules the day with bears dominating, but I’d keep a sharp eye on any sudden uptick in volume or a decisive hold above $80—those could be early fireworks for opportunistic bulls.
Avalanche (AVAX) Price Analysis
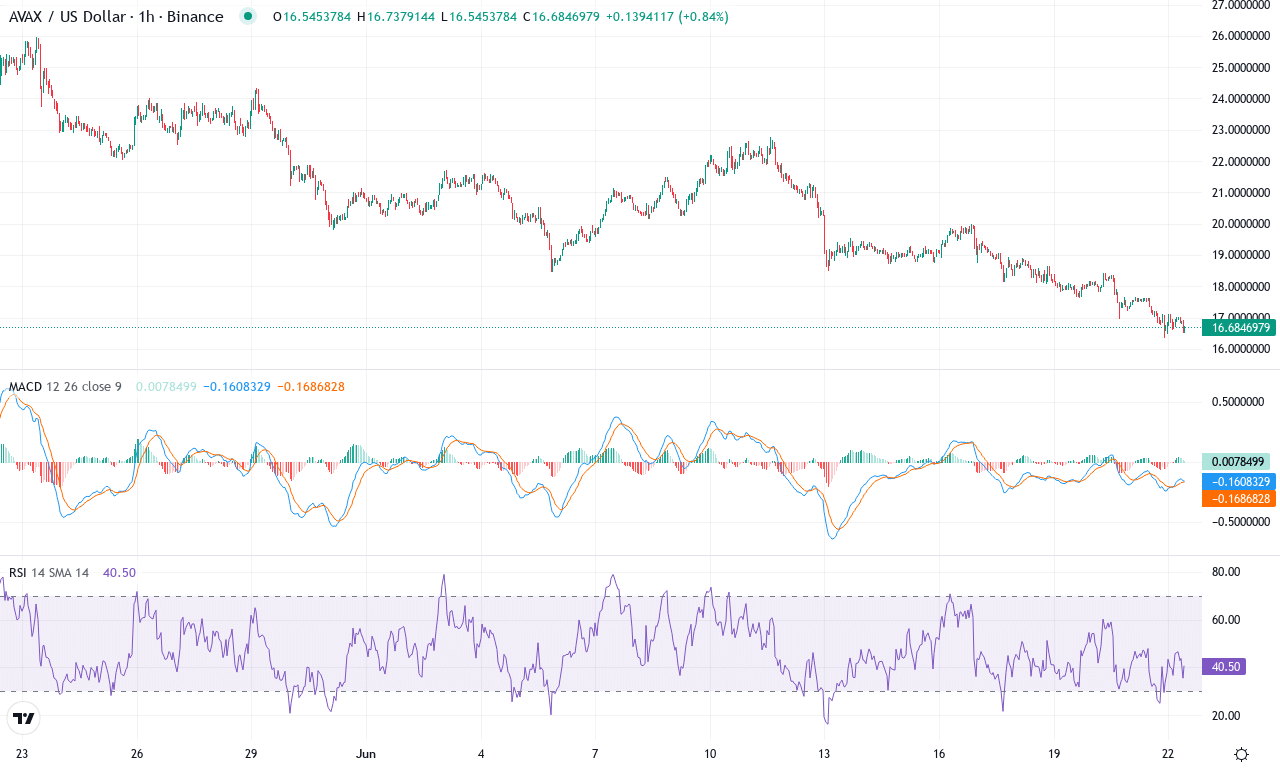
| Crypto | Close | 1W% | 1M% | RSI | ADX | MACD | CCI 20 | AVALANCHE(AVAX) | $16.71 | -11.81% | -33.82% | 30.1 | 20.8 | -1.22 | -143.89 |
|---|
After a brutal month that saw Avalanche tumble more than 33%, AVAX is searching for a foothold amid intensifying volatility. The token’s six-month performance—a sobering 57% drawdown—reflects persistent bearish momentum, and this week alone carved another 11% off the price. AVAX now hovers at $16.70, pressed uncomfortably close to its recent $16.33 low and well beneath the month’s $24 resistance. The technical outlook suggests sellers retain control, and as headwinds grow, the specter of a steep correction looms unless bulls can reclaim lost ground. It’s a dicey juncture; Avalanche is skating on thin ice here, and I’ll be blunt—collapse below current support puts the entire 2024 recovery at risk.
Drilling into the technicals, trend indicators paint a daunting picture. The ADX shows robust trend strength, but with negative directional signals dominant, suggesting bearish forces are still in the driver’s seat. The weekly MACD remains deeply negative and continues its downtrend, while momentum oscillators—including the RSI—rest in oversold territory but haven’t yet triggered a convincing reversal signal. Avalanche is firmly below all critical moving averages, confirming downside pressure and invalidating any bullish thesis for now. The $16 handle is the line in the sand—for AVAX to avoid an extended fall, buyers must step in now. If bulls stage a dramatic bounce here and push the price above psychological resistance at $20, a relief rally could spark, targeting the $22–$24 region. If, however, support fails and sellers accelerate, brace for a fresh leg down; next watch for capitulation around $14 or lower. These are high-stakes levels for Avalanche—don’t underestimate the risks or the potential for a sharp bounce back if sentiment pivots.
XRP (XRP) Price Analysis
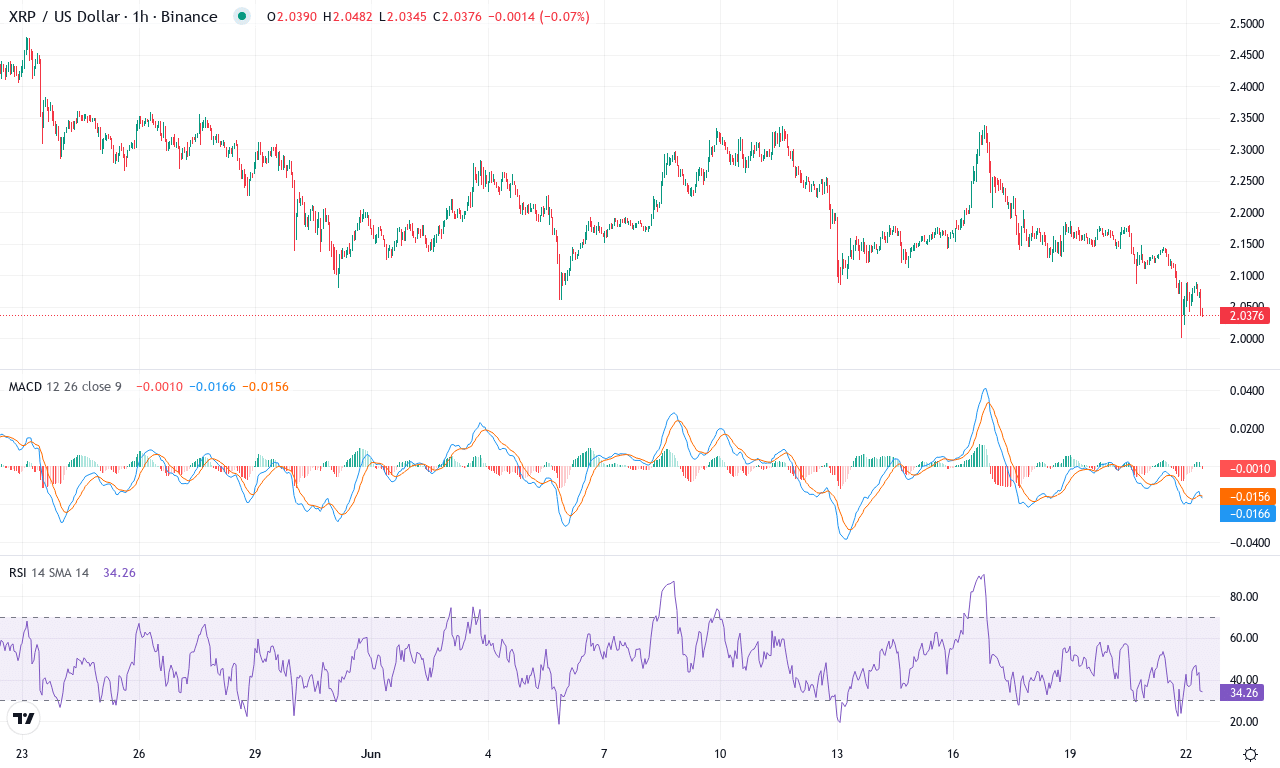
| Crypto | Close | 1W% | 1M% | RSI | ADX | MACD | CCI 20 | XRP(XRP) | $2.04 | -4.55% | -15.84% | 36.8 | 14.9 | -0.04 | -153.22 |
|---|
After a bruising month that saw XRP drop nearly 16%, the token is limping through a volatile phase. Recent weekly price action underscores mounting bearish momentum, with sellers pressing XRP down toward its monthly lows despite the broader market’s attempts at recovery. The technical outlook suggests that XRP is entrenched in a downtrend, with oscillators flashing continued caution and the price hovering dangerously close to the psychological $2.00 mark. While long-term holders may recall the token’s sensational triple-digit yearly returns, the last quarter has erased much of that euphoria—right now, it feels like the market is daring the bulls to step in and rescue XRP from a steeper correction.
Diving deeper into the technicals, trend indicators confirm the bears are in control, as downward pressure accelerates. The ADX reflects a strengthening trend, reinforced by a persistent negative directional index, while the MACD is flatlining below its signal—a textbook warning of waning bullish momentum. RSI has slipped below 50, and other oscillators remain depressed, hinting that sellers could squeeze the price lower before exhaustion sets in. XRP is trading beneath its key short-term moving averages, cementing resistance at the $2.20–$2.30 band right as support at $2.00 becomes critical. If buyers can reclaim $2.20, a relief bounce up to $2.50 is plausible; otherwise, failure to hold the $2.00 level risks an extended fall toward $1.95 or lower. The suspense is brutal for those holding the line—don’t let impatience blur your risk management.
Will Bears Assert Dominance?
Litecoin’s precarious stance near $80 and Avalanche’s struggle around $16.70 underscore the market’s tension, hinting at a potential rebound if oversold conditions trigger persistent buying. XRP’s tight range suggests a delicate balance, with a decisive move yet to emerge. While the outlook remains tense, traders should keep a close watch on support validations and volume indicators to gauge the next directional cue.