Litecoin Monero And Quant Shred Support Zones As Bulls And Bears Brace For Volatility Pivot
Litecoin, Monero, and Quant are making headlines as investors grapple with shifting market dynamics. Recent price movements have shredded key support zones, rattling traders’ nerves and setting the stage for potential volatility. As bulls and bears square off, the technical setups suggest a crucial pivot point is looming. Will buyers reclaim control or will the downward pressures persist? Let’s break down the technical setup across these assets.
Litecoin (LTC) Price Analysis
| Crypto | Close | 1W% | 1M% | RSI | ADX | MACD | CCI 20 |
|---|---|---|---|---|---|---|---|
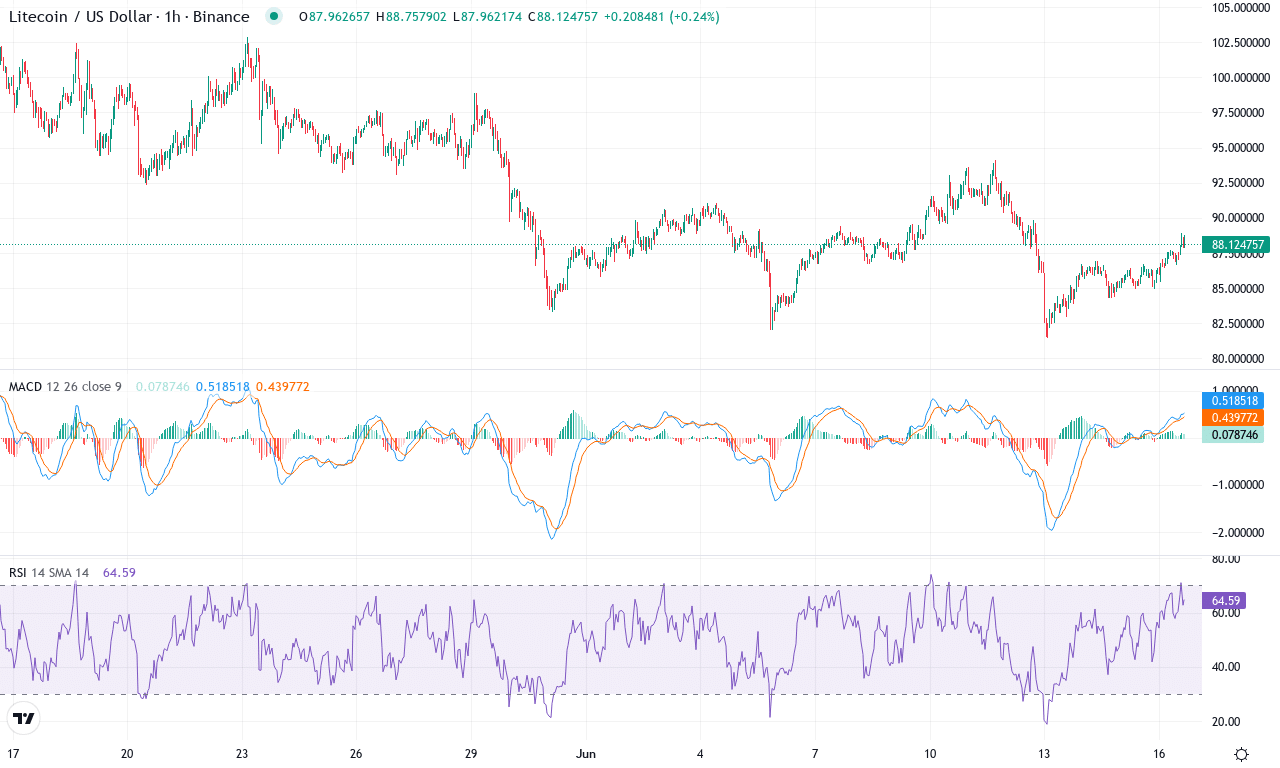
| LITECOIN(LTC) | $88.18 | 1.06% | -11.50% | 47.3 | 19.5 | -1.47 | -32.45 |
After an intense bout of selling, Litecoin is rousing trader attention with its current price holding just above $88—a stone’s throw from this month’s lows but still well below the recent $102 peak. The past month saw a steep 11% drop, underscoring just how quickly bullish momentum can unravel in the crypto space. Short-term sentiment remains conflicted: last week’s negligible move hints at indecision, with sellers and bargain hunters locked in a standoff. Longer-term investors may be licking their wounds, as Litecoin is still down nearly 30% from six months ago despite showing a solid double-digit gain on the year. The technical outlook suggests this is a battle for trend direction, with volatility lingering under the surface. If Litecoin can regain its footing—and the bulls seize control above immediate resistance—the mood could turn on a dime. Until then, I’ll admit my nerves are on edge waiting for a decisive move.
Digging deeper, the trend indicators are flashing warning signs: the ADX remains elevated, suggesting ongoing strength behind the recent directional moves, while negative directional momentum outpaces positive. The MACD signals reinforce the bearish scenario—the line remains below the signal on both daily and weekly timeframes, with no clear evidence of bullish convergence. Oscillators, meanwhile, are hovering near neutral but lean toward caution, with RSI stuck below 50 and momentum readings underwhelming. Price is now teetering near its major moving averages, and a crack below this month’s support around $81 risks an extended fall toward the $76–$65 region, where deeper buyers might re-emerge. On the flip side, if Litecoin can clear resistance at $102, the next upside target hovers near February’s top at $117. The current sideways drift at a critical juncture makes this a market you can’t ignore—confident bears should beware if sentiment flips, but right now, sellers are getting the last word.
Monero (XMR) Price Analysis
| Crypto | Close | 1W% | 1M% | RSI | ADX | MACD | CCI 20 |
|---|---|---|---|---|---|---|---|
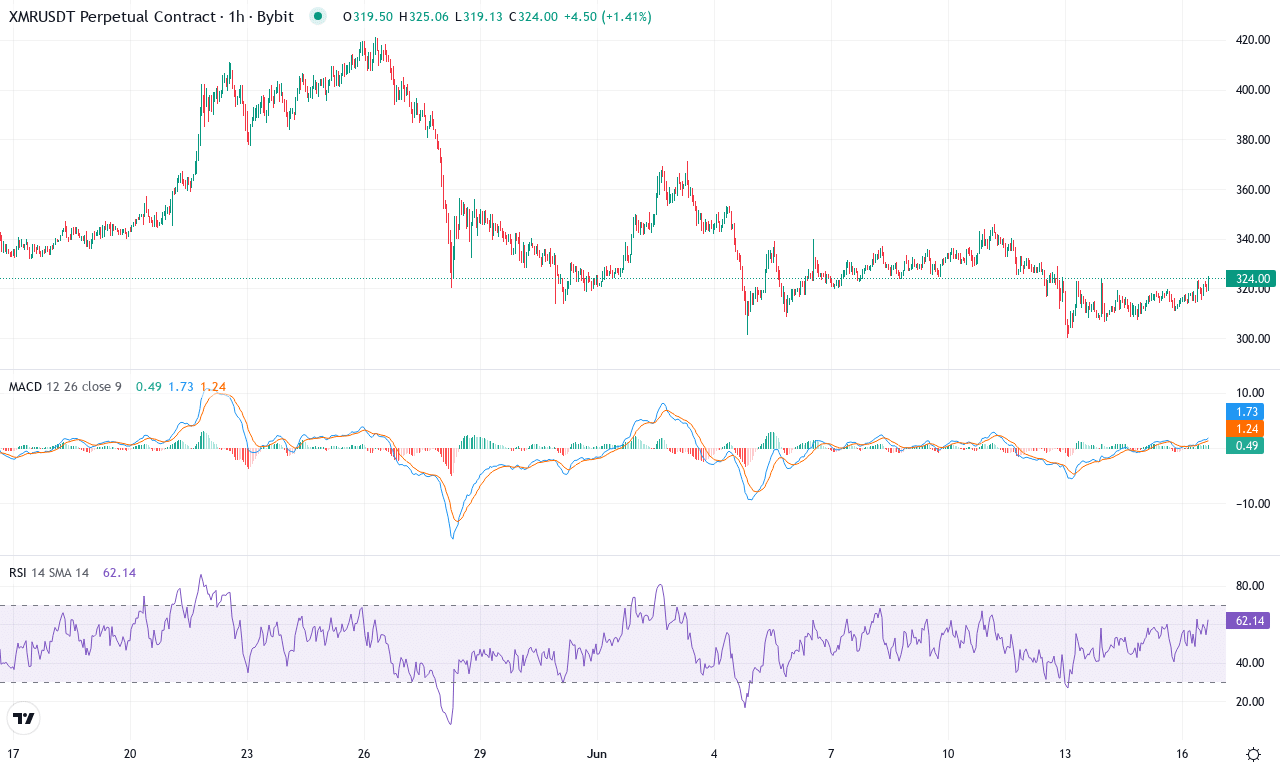
| MONERO(XMR) | $322.86 | -1.35% | -3.19% | 47.1 | 23.1 | -4.69 | -65.19 |
Monero has been navigating a dramatic run over the past quarter, with bulls catapulting the privacy coin nearly 52% higher in three months and over 50% in the last half-year. Yet, June brought a pause as Monero slipped 3% on the month, undercut by a modest pullback of about 1% this past week. After this stellar rally, the market looks at a crossroads: traders are digesting past gains, and the mood is tense as price action hovers near $323, right between a monthly high near $421 and a low around $300. Despite this recent wobble, Monero’s longer-term technical posture remains robust—yearly performance up by a staggering 82%—but it’s clear the easy upside is behind us, at least for now. Personally, I’m keeping my eyes glued to the $300 support; a break there would signal a definite regime shift.
Technically, Monero is flashing mixed signals. Trend indicators show that momentum has cooled dramatically: the MACD line has crossed below its signal on both weekly and daily frames, and other oscillators like RSI and the Commodity Channel Index are pulling back from overbought soil, hinting that bullish momentum is ebbing. The ADX underpins this—trend strength is still present, but direction is softening. On the positive side, Monero is holding just above its 20- and 30-day moving averages, signaling bulls haven’t given up just yet. The immediate resistance zone sits at $337, and a decisive break there—especially if accompanied by revived momentum—could open the door to a fresh surge toward $410, with psychological pressure building above $400. But if sellers drive the price below the $300 mark, bears could force a steep correction toward the $253 support area, where long liquidations and profit-taking risk amplifying downside. In short, Monero is teetering: traders should watch for breakout momentum above resistance, but be prepared to act quickly if $300 fails.
Monero (XMR) Price Analysis

| Crypto | Close | 1W% | 1M% | RSI | ADX | MACD | CCI 20 |
|---|---|---|---|---|---|---|---|
| MONERO(XMR) | $322.86 | -1.35% | -3.19% | 47.1 | 23.1 | -4.69 | -65.19 |
Monero has been navigating a dramatic run over the past quarter, with bulls catapulting the privacy coin nearly 52% higher in three months and over 50% in the last half-year. Yet, June brought a pause as Monero slipped 3% on the month, undercut by a modest pullback of about 1% this past week. After this stellar rally, the market looks at a crossroads: traders are digesting past gains, and the mood is tense as price action hovers near $323, right between a monthly high near $421 and a low around $300. Despite this recent wobble, Monero’s longer-term technical posture remains robust—yearly performance up by a staggering 82%—but it’s clear the easy upside is behind us, at least for now. Personally, I’m keeping my eyes glued to the $300 support; a break there would signal a definite regime shift.
Technically, Monero is flashing mixed signals. Trend indicators show that momentum has cooled dramatically: the MACD line has crossed below its signal on both weekly and daily frames, and other oscillators like RSI and the Commodity Channel Index are pulling back from overbought soil, hinting that bullish momentum is ebbing. The ADX underpins this—trend strength is still present, but direction is softening. On the positive side, Monero is holding just above its 20- and 30-day moving averages, signaling bulls haven’t given up just yet. The immediate resistance zone sits at $337, and a decisive break there—especially if accompanied by revived momentum—could open the door to a fresh surge toward $410, with psychological pressure building above $400. But if sellers drive the price below the $300 mark, bears could force a steep correction toward the $253 support area, where long liquidations and profit-taking risk amplifying downside. In short, Monero is teetering: traders should watch for breakout momentum above resistance, but be prepared to act quickly if $300 fails.
Quant (QNT) Price Analysis
| Crypto | Close | 1W% | 1M% | RSI | ADX | MACD | CCI 20 |
|---|---|---|---|---|---|---|---|
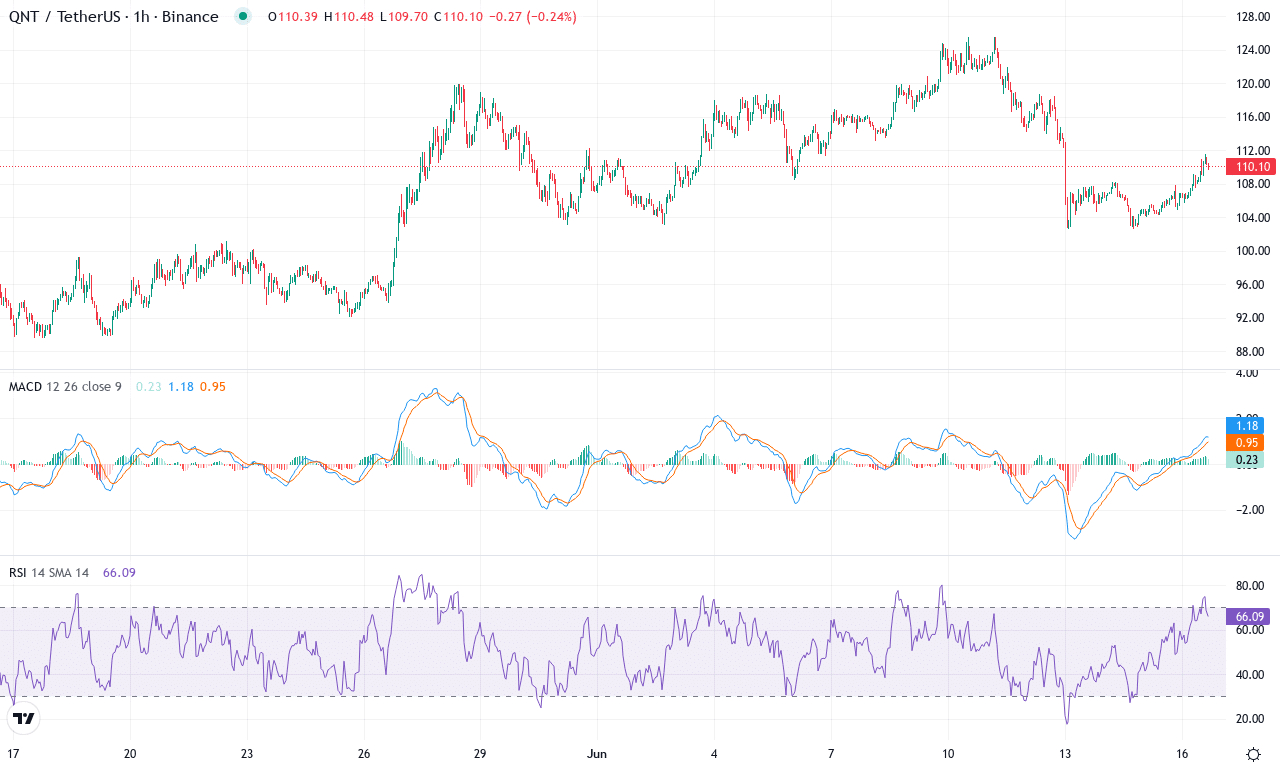
| QUANT(QNT) | $110.18 | -7.76% | 19.84% | 52.4 | 25.1 | 2.73 | -54.77 |
After a powerful 20% surge this month, Quant (QNT) has roared back into the spotlight, breaking out above its 6-month downtrend and touching a high of $125.56 before settling near $110.18. The narrative is shifting: following a volatile dip toward $90, long-term buyers stepped in, triggering a cascade of short covering and renewed institutional inflows. With year-to-date gains over 33% and QNT outperforming the broader market in the last quarter, the mood among traders has turned palpably bullish. If fresh upward momentum materializes and the resistance barrier at $127 is breached, Quant could ignite a new leg higher—something I’ve got my eye on in coming sessions.
The technical outlook suggests that bullish momentum is gathering force. Trend strength indicators are robust, with the trend still firmly pointed higher, while moving averages from the 10-day through 100-day clusters are fanned out beneath current prices—a classic set-up for further gains. The weekly MACD continues to accelerate upside, supported by oscillators and a steady, elevated RSI—though it’s not yet in overheated territory. Price is pressing against a critical resistance zone around $126–$128; if bulls conquer this band, the prior monthly high at $125.56 gives way to a psychological round number target at $150. On the flipside, profit taking or a failed breakout would almost certainly see a retest of support at $101, where the 50-day EMA and historical pivots converge. As volatility swells and traders jockey for position, all signs point to a pivotal showdown that could set Quant’s course for the next quarter.
Monero (XMR) Price Analysis
| Crypto | Close | 1W% | 1M% | RSI | ADX | MACD | CCI 20 |
|---|---|---|---|---|---|---|---|
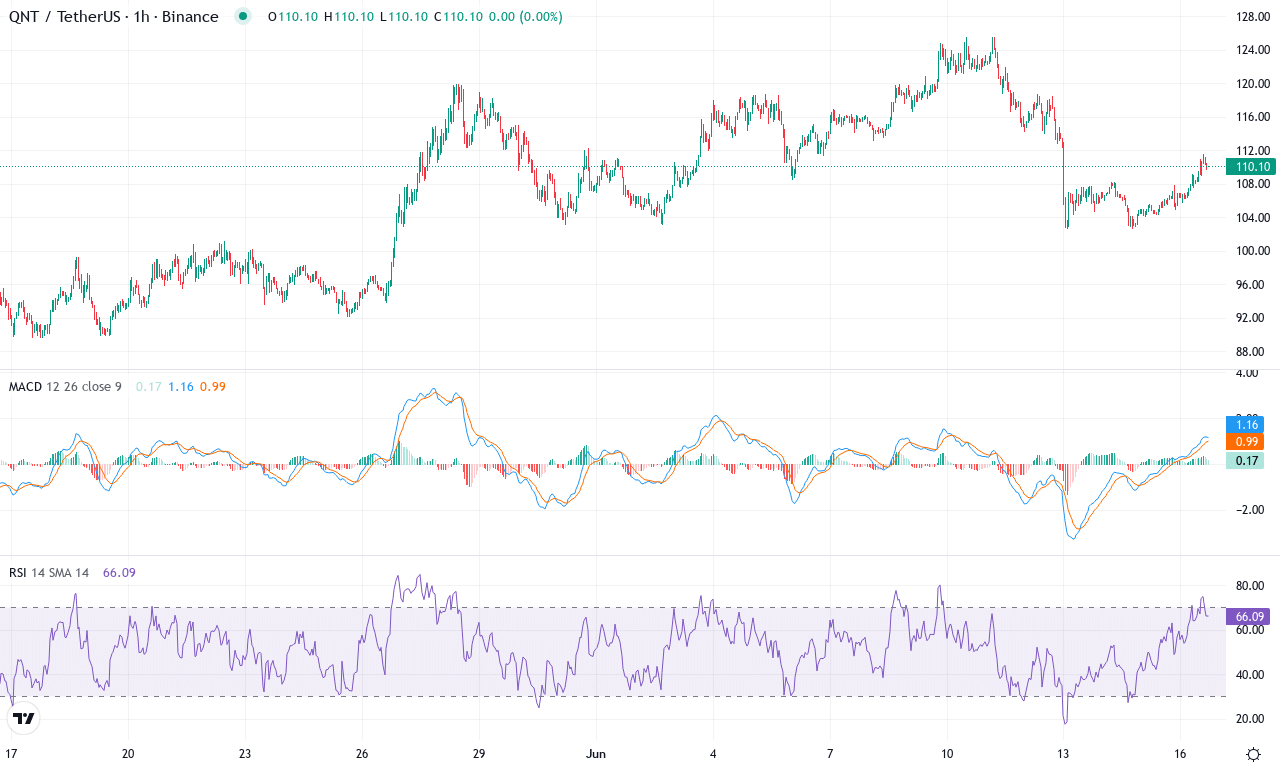
| QUANT(QNT) | $110.18 | -7.76% | 19.84% | 52.4 | 25.1 | 2.73 | -54.77 |
After a powerful 20% surge this month, Quant (QNT) has roared back into the spotlight, breaking out above its 6-month downtrend and touching a high of $125.56 before settling near $110.18. The narrative is shifting: following a volatile dip toward $90, long-term buyers stepped in, triggering a cascade of short covering and renewed institutional inflows. With year-to-date gains over 33% and QNT outperforming the broader market in the last quarter, the mood among traders has turned palpably bullish. If fresh upward momentum materializes and the resistance barrier at $127 is breached, Quant could ignite a new leg higher—something I’ve got my eye on in coming sessions.
The technical outlook suggests that bullish momentum is gathering force. Trend strength indicators are robust, with the trend still firmly pointed higher, while moving averages from the 10-day through 100-day clusters are fanned out beneath current prices—a classic set-up for further gains. The weekly MACD continues to accelerate upside, supported by oscillators and a steady, elevated RSI—though it’s not yet in overheated territory. Price is pressing against a critical resistance zone around $126–$128; if bulls conquer this band, the prior monthly high at $125.56 gives way to a psychological round number target at $150. On the flipside, profit taking or a failed breakout would almost certainly see a retest of support at $101, where the 50-day EMA and historical pivots converge. As volatility swells and traders jockey for position, all signs point to a pivotal showdown that could set Quant’s course for the next quarter.
Assessing the Volatility Pivot
Litecoin hovers near its breached support, with buyers needing to step up to prevent further declines. Monero’s attempt to stabilize faces headwinds unless fresh buying interest emerges, while Quant tests a lower threshold that could open further downside if unsupported. Traders should watch for decisive moves, particularly any bullish reaction that might signal a turn in momentum. In this volatile phase, preparedness is key as the market seeks direction.