
Maker, Injective, and Aave Teeter As Bears Tighten Grip—Is a Major Breakdown Brewing Or Will Bulls Strike Back
Maker, Injective, and Aave are sitting at a technical junction, with recent corrections painting a vivid picture of market unease. Maker’s impressive gains are now clouded by a sharp 17% weekly loss, while Injective grapples with a staggering 30% decline from its peak. Yet, beneath the surface lies a coil of tension—technical indicators suggest both bearish exhaustion and potential setups for a bullish counterattack. Are these just transient setbacks in a broader crypto bull phase or harbingers of deeper transitions? Let’s break down the technical setup across the board.
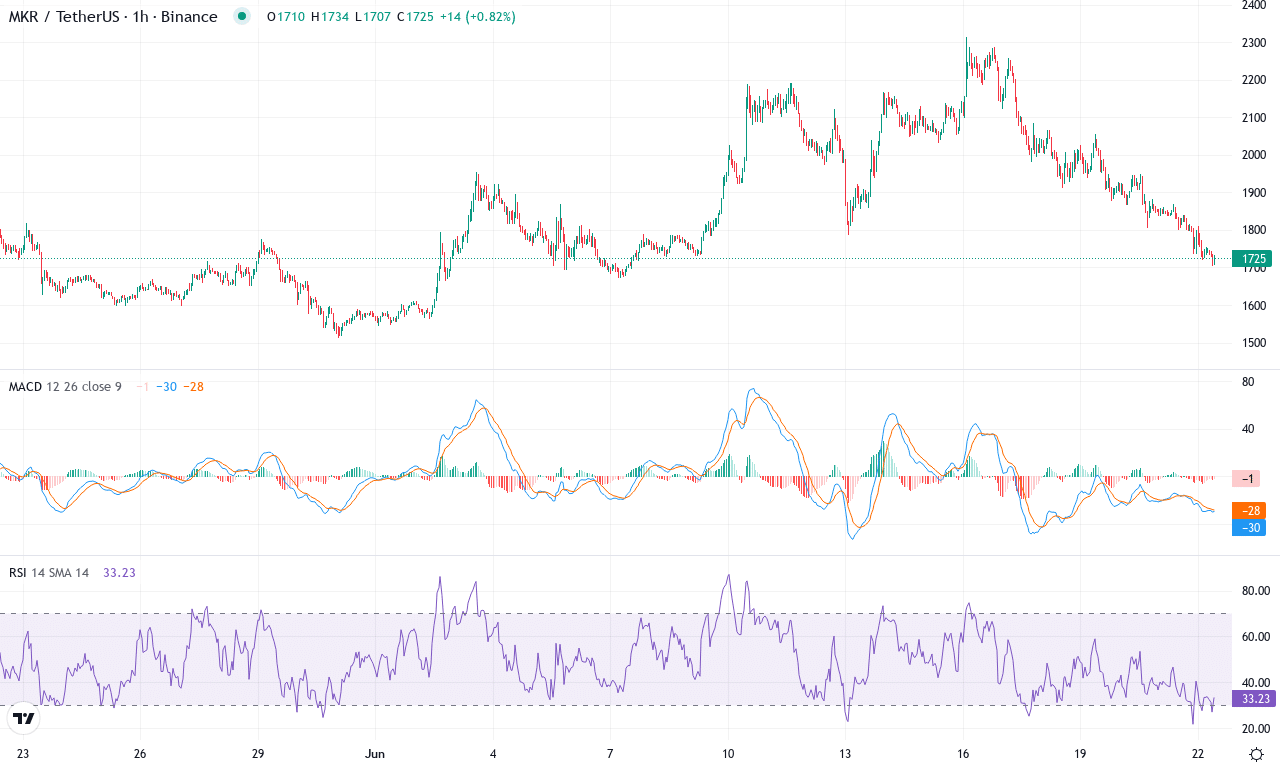
Maker (MKR) Price Analysis
| Crypto | Close | 1W% | 1M% | RSI | ADX | MACD | CCI 20 | MAKER(MKR) | $1727.00 | -17.01% | -1.26% | 42.3 | 19.4 | 33.47 | -91.02 |
|---|
After a blistering first quarter, Maker (MKR) has run into turbulent waters, losing over 17% in just the past week and slipping modestly for the month. The token remains up 40% over the last three months—a testament to lingering bullish conviction—but recent price action hints at a tug-of-war between opportunistic buyers and profit-takers. Currently settling near $1,727, price is anchored between this month’s high at $2,314 and support near the $1,511 low. The shift comes as broader crypto sentiment turns cautious and traders weigh the risk of an extended fall. As headwinds grow, the technical outlook reveals waning bullish momentum: after weeks of upside, short-term oscillators have flipped negative, and a failure to reclaim higher levels could set the stage for further downside. I’m watching closely—sometimes the best trades come when conviction starts to shake.
Digging into the technicals, Maker’s trend indicators remain positive but show early signs of weakness. The average directional index is elevated, suggesting a strong underlying trend, yet the negative directional reading outpaces the positive, reinforcing the recent bearish reversal. The weekly MACD shows a sharp deceleration after months of impressive gains, and the daily histogram has started to lean bearish. Meanwhile, RSI has cooled off from overbought territory, now hovering in neutral ground, and short-term oscillators—already flashing warning signs—suggest that sellers are regaining control. On the moving average front, MKR is clinging to the 10 and 20-day EMAs, but a break below $1,700 could open the floodgates toward major support at $1,500. Conversely, if bulls overcome resistance near $1,900—a level that lines up with both the VWMA and a key psychological barrier—the next serious upside stretch points back toward $2,300 and possibly beyond. The stakes feel high here: if momentum fails to recover, the risks of a steep correction are real, but volatility could deliver opportunity for those nimble enough to act quickly.
Injective (INJ) Price Analysis

| Crypto | Close | 1W% | 1M% | RSI | ADX | MACD | CCI 20 | INJECTIVE(INJ) | $9.77 | -14.68% | -30.50% | 34.2 | 17.8 | -0.54 | -155.99 |
|---|
After a punishing month that saw Injective tumble more than 30% from its peak, the token is limping near $9.77, having been battered down from its high of $15.50. Recent market action is anything but comforting: a sharp 14% drop over the past week has dragged sentiment even lower, compounding the frustration of traders who watched the six-month slide wipe out over half of Injective’s value. The stark reality—INA has decisively lost its medium-term uptrend, and the technical outlook suggests more headwinds ahead unless bulls stage a dramatic turnaround. Even so, periods of aggressive selling can sometimes birth spectacular rebounds; savvy traders know volatility breeds opportunity, not just risk.
Inspecting the technicals, Injective is swimming against a strong current. Trend indicators are shouting caution—trend strength is pronounced, but with negative directional movement clearly in control and the MACD still mired below its signal line, there’s little evidence buyers are ready to fight back. Oscillators are stuck in the bearish grind: RSI is drifting in low gear, well below momentum pivots that signal a reversal, while the Commodity Channel Index remains deeply oversold. Price action paints a similar struggle, with INJ hugging the lower bands of key moving averages and not far above a psychological support zone near $8.80. If bulls can muster enough energy to reclaim resistance at $12.20, the next test looms at $15.50 where sellers last dominated; but if support fails, risks extend toward a protracted fall—possibly toward $8.00 or even lower. Personally, I’m staying nimble: the pain is real, but if history repeats, exhausted bears could soon find themselves on the wrong side of a surprise rally.
Aave (AAVE) Price Analysis

| Crypto | Close | 1W% | 1M% | RSI | ADX | MACD | CCI 20 | AAVE(AAVE) | $229.85 | -16.53% | -10.14% | 37.0 | 20.7 | -0.99 | -147.81 |
|---|
After a strong March rally, Aave has been dealt a reality check—shedding over 16% in just the past week and notching a sharp 10% monthly loss. The volatility surge has been unmistakable; in fact, the token just careened off its monthly high near $325, rapidly unwinding to test the $226 zone. As risk-off sentiment sweeps the broader DeFi sector, Aave’s technical outlook suggests the token is standing at a precarious crossroads. The trend had looked bullish with a three-month run north of 24%, but bears have completely regained control, pushing price below key support markers and sowing anxiety among leveraged longs. Personally, this week’s slide reminds me why risk management is non-negotiable—don’t let one downdraft catch you sleeping.
Oscillators paint a picture of waning momentum, with both MACD and broader trend indicators flipping negative—a classic warning that buyers are exhausted. The weekly MACD has crossed below its signal line, while the awesome oscillator and momentum readings dive into deep negative territory. RSI has tumbled well off its highs but hovers above oversold, hinting at possible further downside before a capitulation bounce materializes. Price has sliced below short and medium-term exponential moving averages, confirming the dominance of bearish momentum. Immediate support sits near $226—the week’s low and a psychological battleground; if this level gets breached, Aave faces risks of an extended fall toward the $180 area. However, should bulls reclaim traction and force a rally above the fallen support/resistance zone at $260, renewed upside could quickly target the $300 mark. For now, sellers are getting their way—stay nimble, and don’t fight the dominant downtrend until the tape proves otherwise.
A Tipping Point for Maker, Injective, and Aave
As Maker flirts with its recent lows, Injective and Aave await directional cues amid bearish pressures. A decisive move could hinge on whether bulls muster enough strength to counter the prevailing downtrend. While the indicators hint at potential reversals, the upcoming sessions will be crucial to confirming any sustained recovery. Traders should be alert for shifts in volume as key price levels face the test.