MKR Bulls Test Resistance as COMP Eyes Breakout Momentum Amid DeFi Reawakening
After an uneventful phase, Maker (MKR) has sprung to life with a robust 12% gain, climbing from its base at $1,511 to $1,770 amid the broader DeFi sector’s resurgence. With resistance hovering near the monthly high at $1,962, bulls are poised for a critical showdown that could redefine near-term trends. Will this momentum spark a fresh rally, or is the market setting up for a deceptive pullback? Let’s take a closer look at the signals behind the move.
Maker (MKR) Price Analysis
| Crypto | Close | 1W% | 1M% | RSI | ADX | MACD | CCI 20 |
|---|---|---|---|---|---|---|---|
| MAKER (MKR) | $1770.00 | 12.60% | 3.75% | 55.5 | 20.6 | 27.81 | 66.10 |
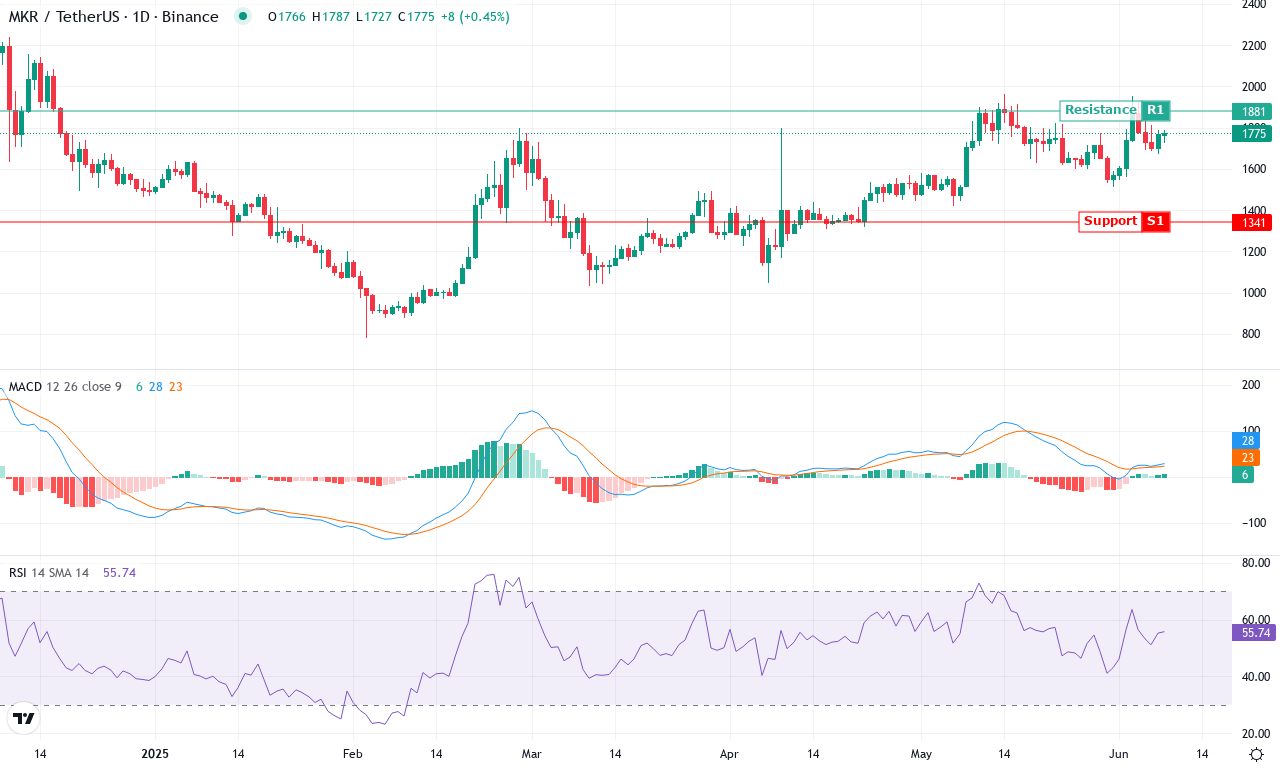
After a month of sideways churn, Maker (MKR) is showing revival traits that should catch every trader’s attention. Over the last week, MKR notched a solid 12% gain after a lackluster quarter, surging from support near $1,511 up toward its current close at $1,770. The 3-month rally, with gains just shy of 50%, has been tempered by recent volatility, but bulls seem determined to keep the recovery intact—especially given the cascade of profit booking and a prior 6-month retracement phase. The technical outlook suggests a pivotal shift in momentum: both the weekly and daily trend indicators are signaling higher, and the price is trading decisively above its key moving averages, most notably the 10-day and 20-day EMAs. There’s real tension building as buyers challenge a stubborn resistance wall just shy of the monthly high at $1,962; if they manage a convincing breakout, I’d expect another bout of upside fireworks.
Digging deeper into the technicals, trend strength is robust—ADX remains elevated, and positive directional indicators far outweigh negative, confirming bulls have seized control of the tape. The MACD line is accelerating higher on both daily and weekly frames, underpinned by a surging Awesome Oscillator and momentum spikes—a clear setup for further gains if sustained. RSI is climbing but not yet overheated, so overbought risks are present but not flashing full warning just yet; oscillators as a group support continued upside, though some short-term froth is setting in. The current price activity is comfortably perched above nearly all major moving averages and the volume-weighted average, showing institutional demand is picking up. If bulls clear that monthly high at $1,962, the next resistance cluster looms around $2,191, with psychological interest likely near the $2,000 round number. Conversely, failure to sustain above $1,700 could invite rapid profit-taking and a possible retest of the key support band in the $1,540–$1,510 zone. All signs point to a potential breakout—just don’t blink if volatility surges.
On the other hand, Compound (COMP) is catching eyes with a 17% weekly rebound after a prolonged decline. The stage is set for a potential breakout if it can safely maneuver past the $55 barrier. Are traders witnessing the start of a compelling recovery, or will previous resistance hold firm? Time to dive into the charts.
Compound (COMP) Price Analysis
| Crypto | Close | 1W% | 1M% | RSI | ADX | MACD | CCI 20 |
|---|---|---|---|---|---|---|---|
| COMPOUND (COMP) | $47.40 | 16.66% | 8.67% | 61.0 | 22.1 | 0.55 | 146.45 |
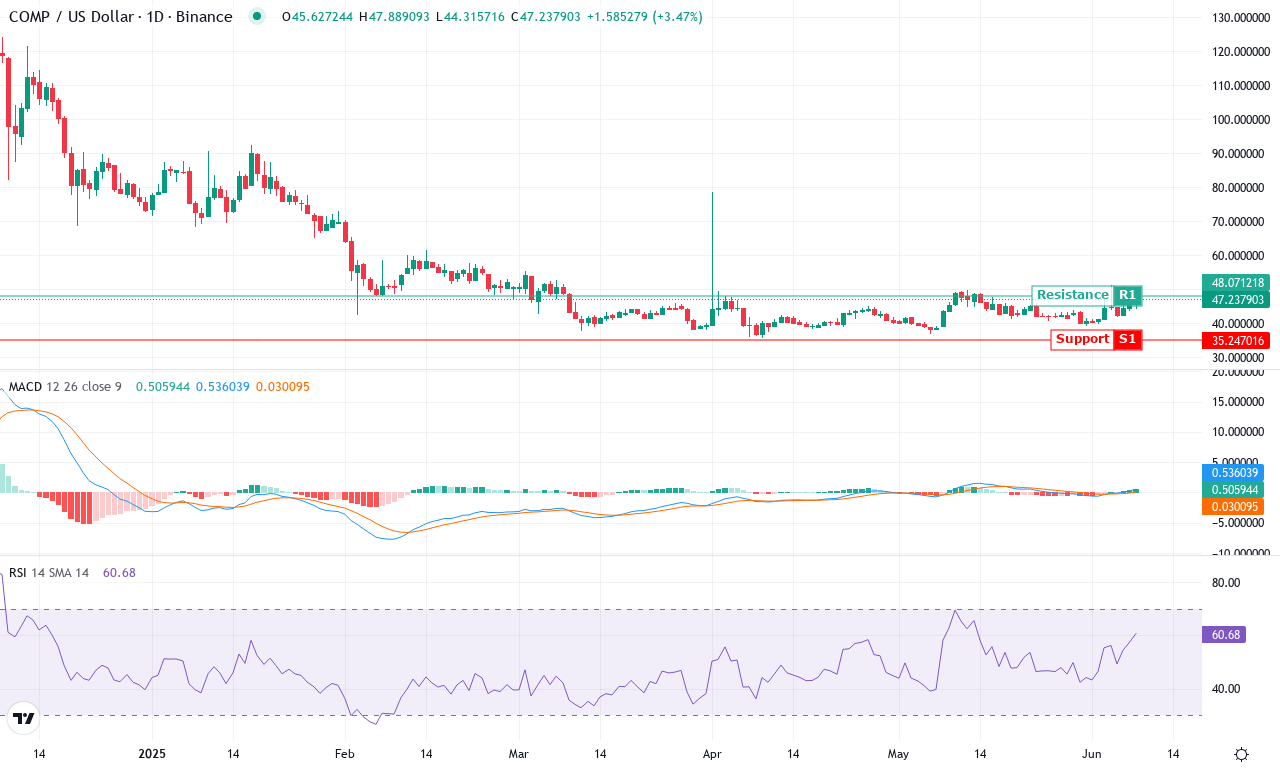
After an extended period of heavy selling and volatility, Compound (COMP) is showing subtle signs of stabilization and renewed strength. The token’s recent bounce—up nearly 17% on the week and closing the month with an 8.7% gain—marks a sharp contrast to its bleak six-month performance, which saw a brutal 51% slide. This latest surge has pulled COMP clear of its monthly low near $39, now trading just shy of the $51.40 high watermark. The recovery is still in its infancy, but the technical outlook suggests a crucial inflection point: bullish traders are finally showing willingness to step in as price inches above major moving averages, and sellers pull back. Frankly, after all the pain in DeFi tokens lately, I’m relieved to see buyers testing the waters again.
Digging deeper, trend indicators are beginning to shift in the bulls’ favor. The ADX reveals strengthening trend conditions, while a marked upturn in the positive directional index signals that bullish momentum is no longer just wishful thinking. On the weekly chart, the MACD is still negative but is clawing upward, and the histogram’s reduced negativity hints at the early stages of moving average convergence—classic signs a bottom could be forming. Oscillators, including RSI hovering near 61, point to building, but not yet overextended, buying interest. Compound is currently riding its short-term exponential moving averages, and if buyers can break above resistance near $55, a swift run toward $68 is in play. However, failure to hold the $44 zone could see bears regain control, risking an ugly drop back toward the $40 round number. The story is far from resolved, but with conviction brewing under the surface, keep a close watch—momentum shifts like these sometimes spark the best rallies.
Next Steps for MKR and COMP
MKR approaches its key resistance at $1,962, with a breakout potentially confirming a bullish trend extension. Meanwhile, COMP eyes $55, where success would solidify the recovery narrative. Both coins signal potential upside, yet traders should watch closely for reversals as the DeFi market seeks its next direction.