Monero And OKB Diverge Sharply As Bears Grip XMR While OKB Eyes Momentum Shift
Monero and OKB are charting divergent paths as market forces pull them in different directions. While Monero struggles to maintain momentum amid bearish pressure, OKB is showing signs of a potential shift, evidenced by a notable rise in RSI. Will Monero’s consolidation phase pave the way for a recovery, or is OKB on the brink of capitalizing on its bullish signals? Here’s what the key indicators are suggesting now.
Monero (XMR) Price Analysis
| Crypto | Close | 1W% | 1M% | RSI | ADX | MACD | CCI 20 |
|---|---|---|---|---|---|---|---|
| MONERO(XMR) | $323.34 | 3.01% | -3.95% | 45.7 | 25.0 | -1.26 | -67.46 |
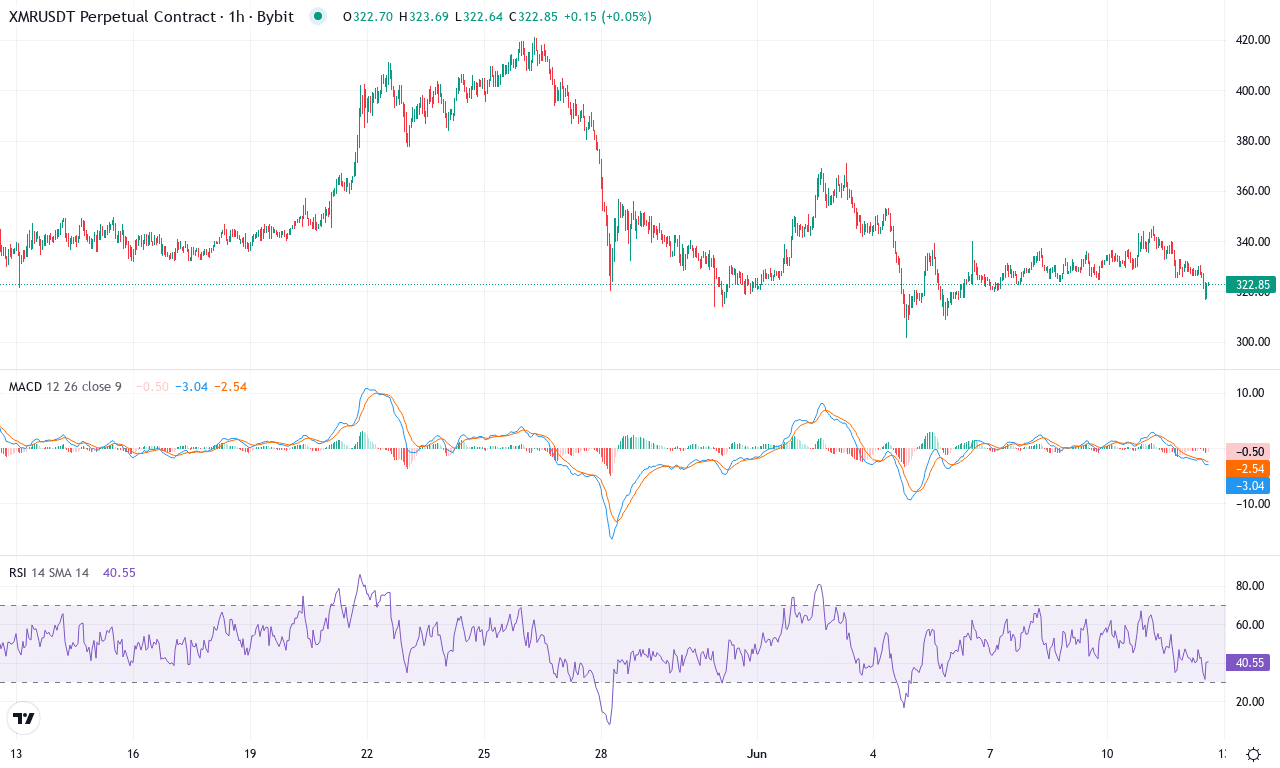
After a blistering three-month rally, Monero (XMR) has hit turbulence, retreating nearly 4% this month as profit-taking sets in. The coin soared over 56% in the last quarter, a testament to surging institutional interest and renewed demand for privacy assets, but the latest downturn signals hesitation as it trades well below the monthly peak of $421. With Monero now hovering just above $320—right at the midpoint of its recent range—traders find themselves at a pivotal juncture. Short-term volatility is picking up and market nerves are palpable; personally, I can’t help but feel some suspense as XMR stares down a critical crossroads for its near-term trajectory.
Technical indicators add drama to the outlook. Trend tools now show Monero losing steam: ADX is firm, but the gap between positive and negative trend lines is narrowing, implying bulls aren’t in full control. The weekly MACD flipped bearishly, while the daily MACD threatens a crossover—classic warning signs that bullish momentum is fading. Oscillators echo this weakness; RSI and CCI are slipping from earlier highs, and the price hovers dangerously close to its 50-period moving average. If bears push XMR below support at $300, risks of an extended fall to the $250 zone grow considerably. On the flip side, should buyers recover control and break above resistance at $340, the stage looks set for another assault on $400 and above. For now, all eyes are on price action near these critical pivots—a make-or-break setup, and I’m certainly keeping my stops tight.
OKB (OKB) Price Analysis
| Crypto | Close | 1W% | 1M% | RSI | ADX | MACD | CCI 20 |
|---|---|---|---|---|---|---|---|
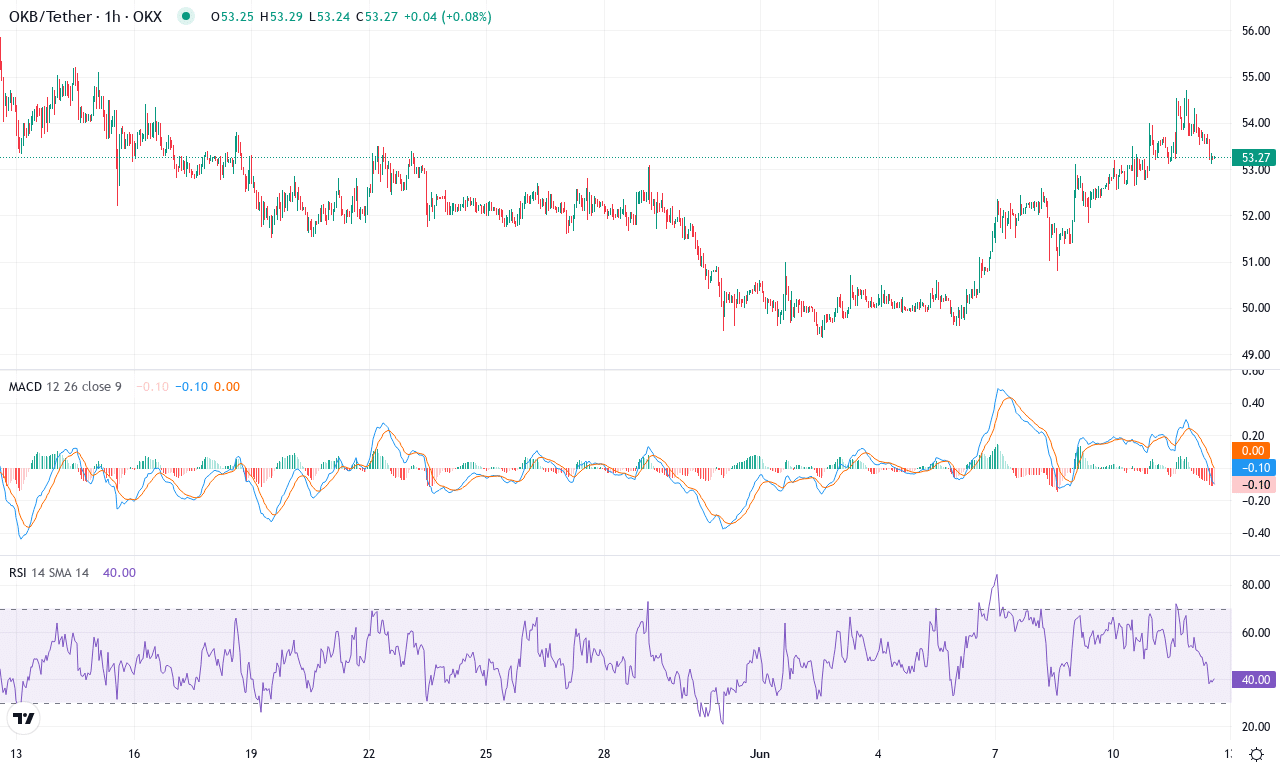
| OKB(OKB) | $53.27 | 6.50% | -1.91% | 58.8 | 14.5 | 0.24 | 119.50 |
After a choppy month punctuated by profit-taking and swift rebounds, OKB is regaining its bullish composure, closing the week with a 6.5% gain that stands out against a recent monthly dip of nearly 2%. The broader context shows substantial three-month appreciation—nearly 29%—suggesting larger institutional demand remains in play, even as short-term volatility keeps traders on edge. Notably, OKB has recaptured ground off its $49.34 monthly low, pushing once again above key moving averages and trading decisively near $53. With the trend backdrop still positive on the year (up over 17%), this coin refuses to roll over—bulls are clearly not done yet.
Diving into the technical outlook, OKB’s trend indicators reveal robust directionality: the ADX is perched in the high teens with the positive DI line dominant, confirming that recent buying power isn’t just noise. The weekly MACD shows acceleration, and both the awesome oscillator and short-term momentum readings are trending higher, hinting at underlying strength. RSI hovers just below traditional overbought levels but still allows further upside before signaling exhaustion; I’d keep an eye on any moves above 70 for warning shots. OKB is nestled above clustered exponential moving averages and its Ichimoku base line, putting the bulls in the driver’s seat so long as $52 holds. If buyers manage to clear resistance near $58.70, a surge toward the monthly high at $55.21—and potentially beyond—looks firmly on the table. However, a failure to hold above the $52 area could trigger a volatile retest of the $50 support zone. Frankly, if OKB snaps through $58, I’d be tempted to add—momentum is swelling, and all signs point to a possible breakout. Stay sharp; this one’s not for the sideline.
Will Divergent Paths Continue?
Monero faces persistent bearish pressure, inching towards support with little sign of immediate recovery. Meanwhile, OKB’s momentum hints at a potential upside, contingent on sustaining its RSI strength. Traders should watch for Monero’s consolidation signs and OKB’s follow-through as decisive moves loom.