OKB Holds Steady, XDC Teeters, KAIA Presses Higher—Will Volatility Ignite a Major Cross-Market Move?
As OKB silently climbs nearly 3% into a zone of quiet consolidation, other tokens tell a more volatile tale, with XDC sliding 16% and Kaia (KAIA) enjoying an 85% quarterly surge. This seemingly calm exterior masks significant undercurrents of market volatility, hinting at an impending cross-market move as broader crypto trends diverge. Will the resilience of OKB break under pressure, or is it the precursor to a bigger breakout? As KEIA makes waves with its gains, the technical setup suggests interesting plays ahead. Let’s break down the shifting dynamics across these technical landscapes.
OKB (OKB) Price Analysis
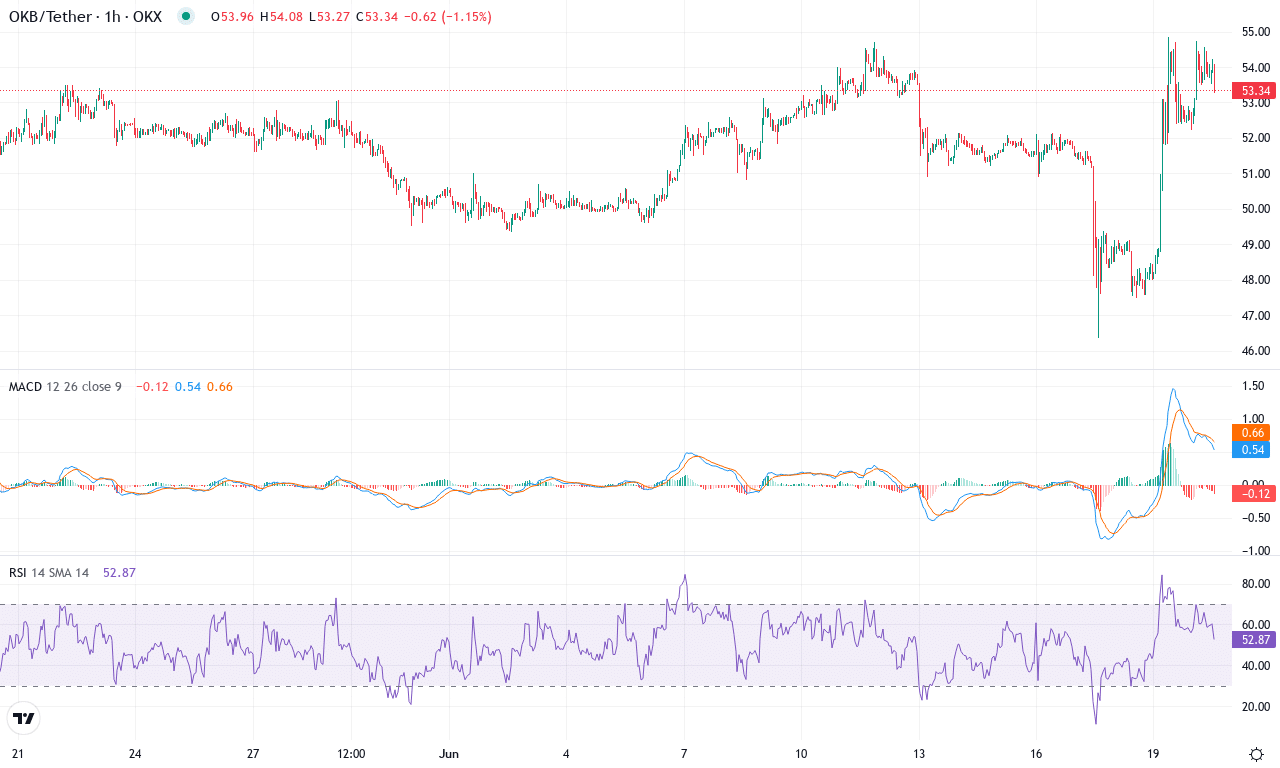
| Crypto | Close | 1W% | 1M% | RSI | ADX | MACD | CCI 20 | OKB(OKB) | $53.73 | 0.37% | 2.93% | 58.3 | 15.9 | -0.12 | 115.98 |
|---|
OKB has managed to maintain its composure within a choppy broader market, slipping quietly higher by almost 3% over the last month and holding its ground after a week of range-bound price action. For a token as closely watched by institutional players as OKB, this relative stability—alongside a steady 19% gain over six months—suggests undercurrents of accumulation, even if the headlines are elsewhere. The price hovers near $53.73, just a whisker below its monthly high, while longer-term EMAs continue to slope upward, painting a picture of resilience and quiet bullish momentum. The narrative here isn’t about explosive rallies, but rather about a base-building phase that keeps OKB primed for the next volatility surge—especially if larger caps start to catch a bid. If we see OKB close above the stubborn monthly resistance at $54.85, it could trigger a fresh wave of technical buying. And as a trader, I have to admit, that sort of slow-burn breakout is often the most satisfying.
Technically, the backdrop reveals a constructive undertone: trend indicators confirm that the bulls are still in control, with a high ADX reading and positive directional bias outpacing sellers by a comfortable margin. While the weekly MACD shows a slight uptick—suggesting that bullish momentum is regaining strength—the daily MACD remains flat, underscoring the market’s patience here. Oscillators, including the RSI, hover just above mid-range levels, indicating neither overbought exuberance nor oversold risk. Price action has clung to its short-term moving averages, further confirming that institutional demand may be providing a safety net on dips. Support rests near the $50.60–$51 zone, guarded by multiple moving averages, while resistance looms at the psychologically important $55 level and the monthly high. If bulls can clear that ceiling and we see a convincing move past $55, the doors open for a climb toward $58; on the flip side, a break below $50 would risk a steeper correction toward $47. As I watch this chart, it’s clear: OKB is winding the spring—when the breakout comes, the reaction could be swift and dramatic.
XDC Networks (XDC) Price Analysis
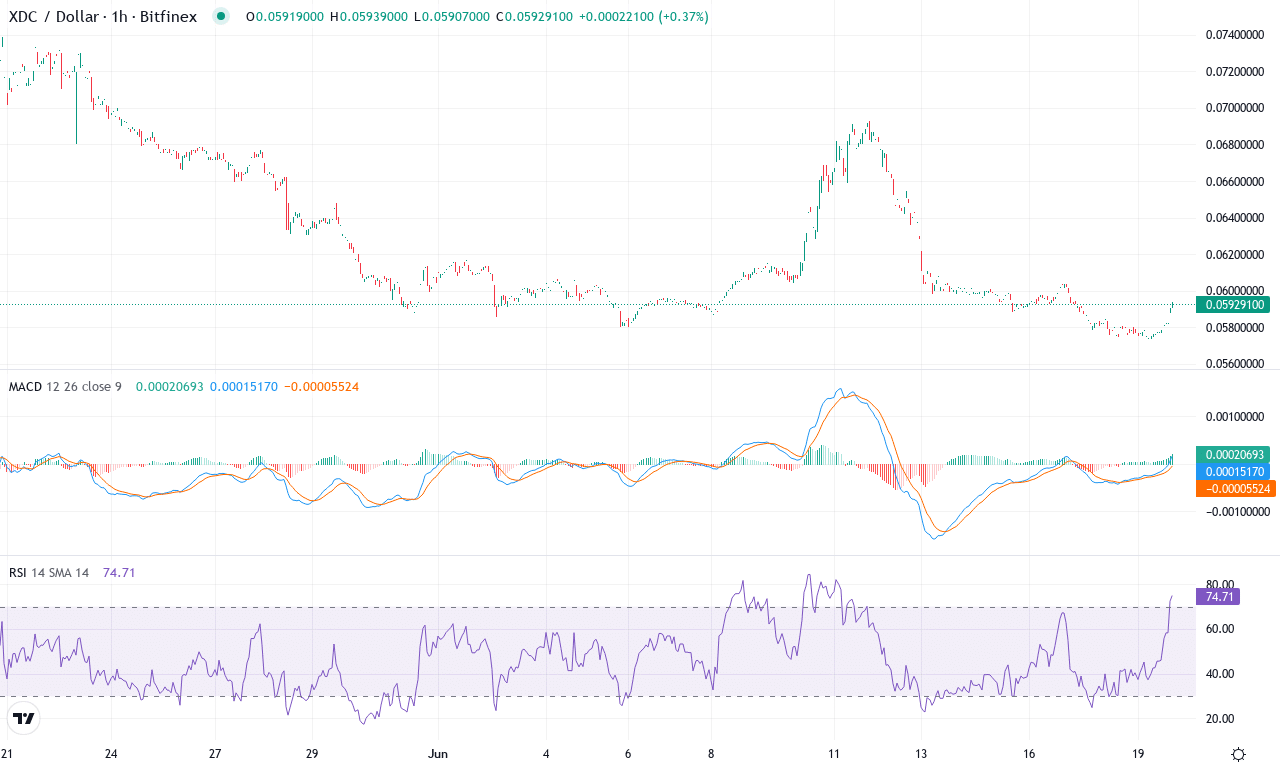
| Crypto | Close | 1W% | 1M% | RSI | ADX | MACD | CCI 20 | XDC NETWORKS(XDC) | $0.06 | -4.68% | -16.27% | 41.8 | 24.8 | 0.00 | -62.97 |
|---|
After a punishing month with XDC Networks tumbling over 16% and extending its corrective slide across the last quarter, traders are right to feel rattled. What stands out now is the consolidation around the $0.059 zone—a far cry from the monthly highs at $0.073, and a chilling reminder of how swiftly profit booking can erase prior gains. The technical outlook suggests that bearish momentum has not just lingered but deepened, with the longer-term downtrend stretching back six months despite a remarkable yearly rally of over 78%. It’s been a sobering reversal: after the altitude of last year’s run, XDC is struggling to reclaim even its short-term moving averages, let alone challenge upside resistance.
Digging into the technicals, trend indicators have spiked—trend strength is high, but for now, it’s tilting in favor of the bears. Both the weekly and daily MACD remain subdued just below the signal line, hinting at tepid momentum and little appetite for a bullish turnaround. Oscillators like the RSI hover in the low-to-mid 40s, pointing to oversold conditions without quite flashing a bottom—so buyers considering a bounce should stay cautious. XDC’s price is pinned underneath all key exponential moving averages (from the fast 10-day out to the 200-day), reinforcing bearish conviction, while the support at $0.057 looms as the last real bulwark before risks of an extended fall take hold. If bulls can muster a push above $0.066, a run toward the monthly pivot near $0.073 becomes possible—but failure to defend current levels could spiral into a steeper correction down to the $0.053 zone. I’m watching for a volatility surge; it’s a dangerous zone, and the next move could be explosive. Stay nimble—this market can turn on a dime.
Kaia (KAIA) Price Analysis
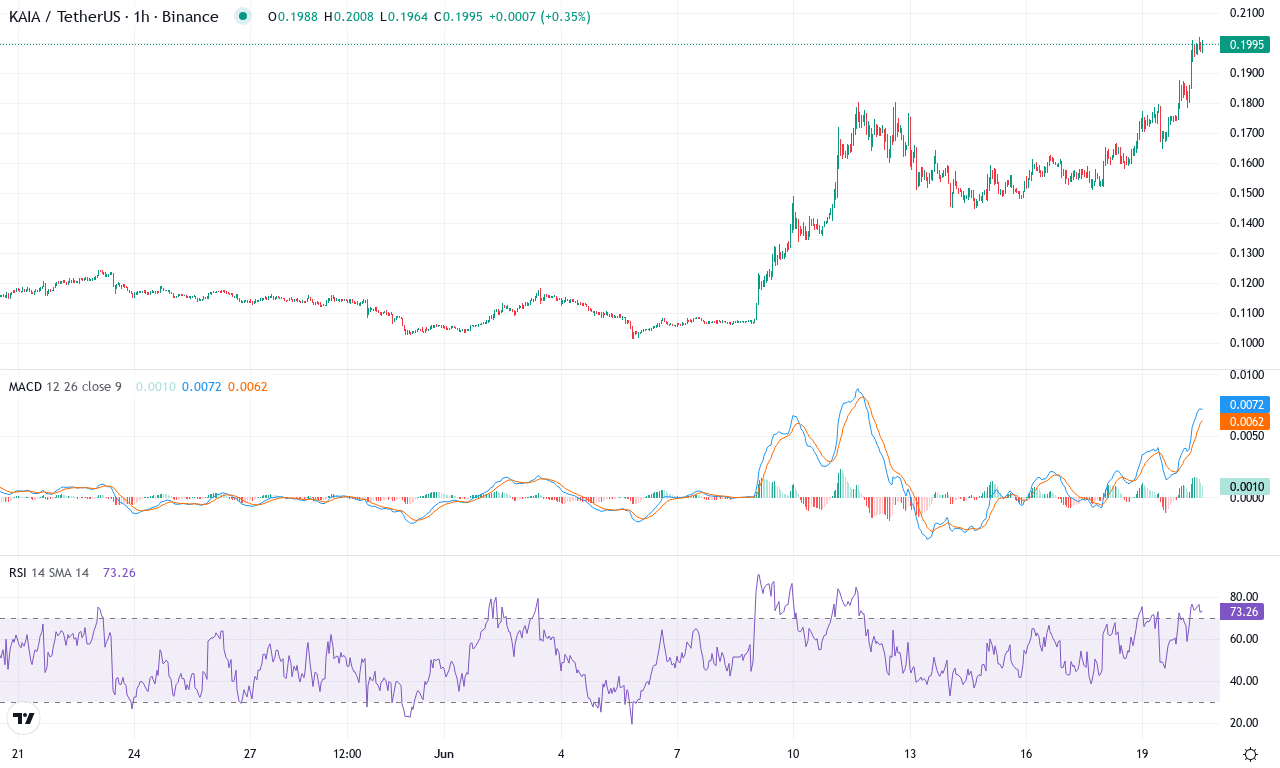
| Crypto | Close | 1W% | 1M% | RSI | ADX | MACD | CCI 20 | KAIA(KAIA) | $0.20 | 12.73% | 67.51% | 75.4 | 36.5 | 0.02 | 137.45 |
|---|
After a thunderous 67% monthly rally and an 85% surge over the past quarter, Kaia (KAIA) has emerged from the shadows as one of the market’s best-performing mid-caps. This explosive recovery comes after a brutal six-month drawdown, highlighting just how much sentiment has flipped. The price currently hovers just beneath its monthly high, suggesting that bulls are refusing to back down—even amid increased volatility. With a stellar 12% gain in the past week alone, it seems profit-taking has barely put a dent in bullish momentum. From a wider lens, this reversal signals the end of a prolonged correction, and I can’t help but feel a bit of FOMO watching the strength Kaia’s showing right now.
Technically, the setup is equally compelling. Most major trend indicators are pointing higher—the ADX reveals strengthening trend intensity, while the Positive Directional Index easily outpaces the Negative, confirming that buyers remain in firm control. The weekly MACD shows acceleration, and both the momentum oscillator and Awesome Oscillator are now printing bullish readings, adding further conviction to the rally case. Price action analysis reveals KAIA is pressing against a key resistance just above $0.20; if bulls manage a weekly close above this level, the next upside target appears around $0.23. But let’s not get carried away: the recent rally has pushed the RSI near overbought territory, so short-term exhaustion or a pullback to the $0.15 support zone would offer a healthier reset before further gains. If sellers briefly reclaim momentum, that’s the level I’d watch for opportunistic entries—otherwise, a clean breakout here promises another volatility surge. All signs point to an inflection point—momentum is swelling, but risk management remains top priority for anyone jumping in after this breathtaking run.
Anticipating the Next Market Wave
OKB remains steady amidst a holding pattern, suggesting potential energy build-up, while XDC fights to stabilize after substantial declines. KAIA continues its impressive rise, hinting at further gains if momentum sustains. The stage is set for potential cross-market movements—traders will need to watch for volume spikes and directional shifts as indicators of the market’s next move.

