Pepe, OKB, And UNI Teeter At Critical Levels As Breakout Volatility Brews
As Pepe, OKB, and Uniswap navigate critical thresholds, the crypto market brims with volatility and anticipation. With Pepe’s recent 56% quarterly surge now facing a corrective pause, OKB teetering on monthly lows, and Uniswap flaunting an impressive revival, traders are puzzled by divergent paths. As technical signals grow ambiguous with each passing day, a strategic inflection point looms. Will these assets confirm their trending directions, or is a sudden shift on the cards? Let’s take a closer look at the signals behind the move.
Pepe (PEPE) Price Analysis
| Crypto | Close | 1W% | 1M% | RSI | ADX | MACD | CCI 20 | PEPE(PEPE) | $0.00 | -1.15% | -8.45% | 47.2 | 19.3 | 0.00 | -61.15 |
|---|
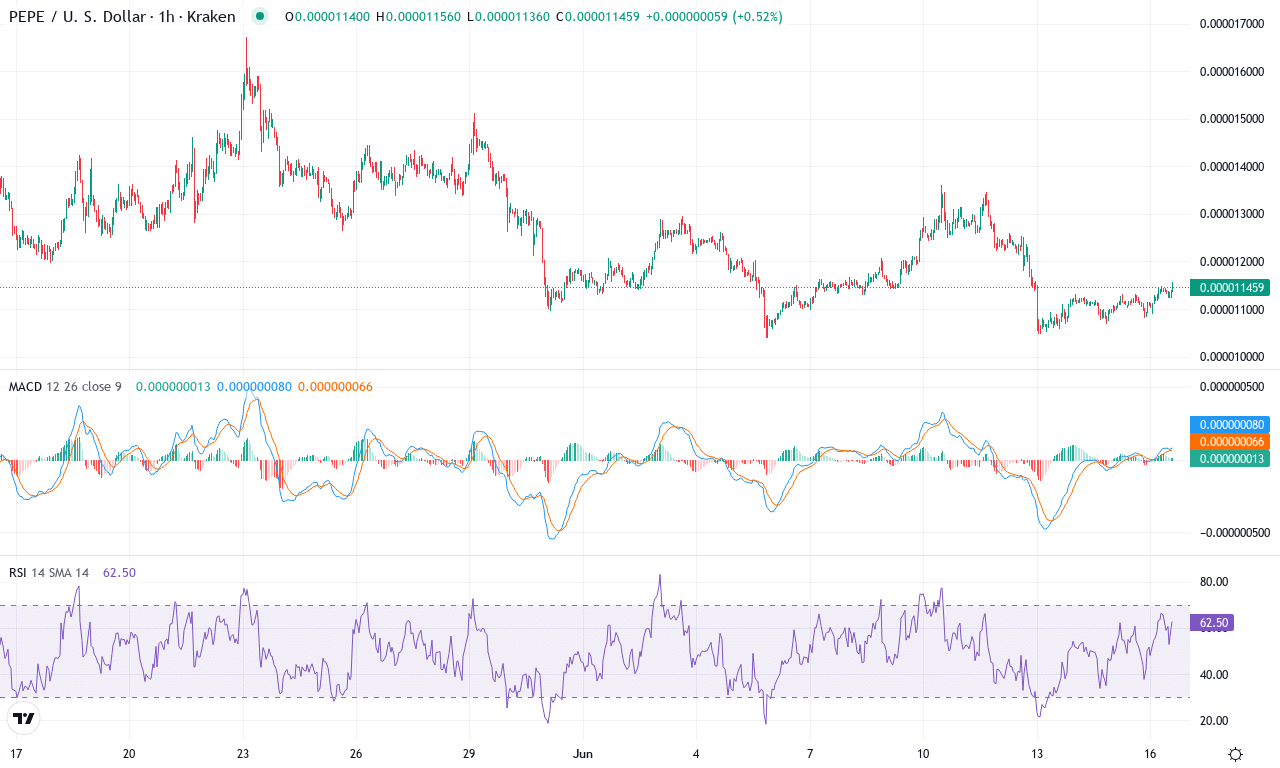
After an explosive rally over the past quarter, Pepe (PEPE) finds itself in the midst of a sharp retracement. Despite booking an impressive 56% gain over three months, this meme coin has since shed close to 8.5% for the month, and last week sellers tightened their grip further with a small but telling 1.1% dip. The technical backdrop has shifted noticeably—after wild upside volatility, price action now hovers uncomfortably close to key moving averages and the monthly pivot, hinting at indecision. As profit-taking surges, I’m watching with a mix of anticipation and caution, wondering if this is merely a breather before renewed upside or the start of a deeper, risk-laden correction.
The trend indicators show Pepe’s rally has lost steam. The directional index, while still relatively strong, suggests neither bulls nor bears are fully in control—as if the coin is pausing for breath after a sprint. The weekly MACD is curling sideways, signaling momentum waning, while a declining RSI—still above 50 but trending lower—hints at fading bullish energy. Oscillators point to a market struggling for direction, and the current close price is sitting just beneath stiff resistance at $0.000012, right between congestion from the 10- and 50-day EMAs. If buyers can mount a resurgence and close firmly above $0.000012, the door opens to a retest of the recent $0.0000167 monthly high. Failure here, however, could trigger a steep correction, exposing Pepe to a slide back towards key support in the $0.0000104 zone. Volatility is tightening—the next directional move could be dramatic. I’m bracing for a breakout, but holding steady until the chart picks a clear side.
OKB (OKB) Price Analysis
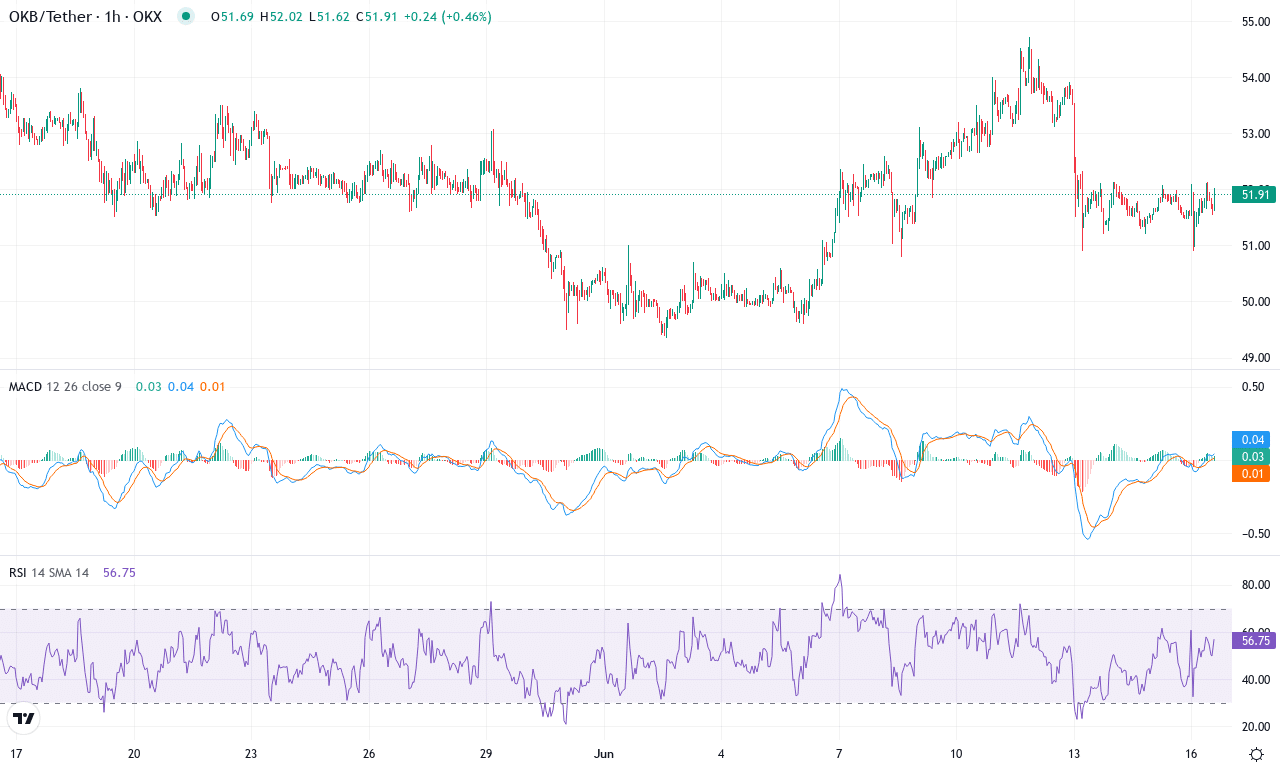
| Crypto | Close | 1W% | 1M% | RSI | ADX | MACD | CCI 20 | OKB(OKB) | $51.95 | 0.13% | -2.93% | 49.6 | 12.7 | 0.05 | 6.02 |
|---|
OKB has spent the past month drifting lower, losing nearly 3% after a tepid climb to $54.72 fell flat against waning bullish conviction. Despite a mild bounce this week, there’s an unmistakable sense of exhaustion in the recent price action—particularly when viewed in the context of its broader, choppy six-month spell. Bulls appear to be hesitating near the $52 pivot, unable to spark meaningful upside even with altcoin sentiment showing brief flashes of strength. Institutional demand remains subdued, and the repeated fade from this resistance area hints at a market unwilling to commit to a breakout. For the moment, OKB is trading uncomfortably close to its monthly lows at $49.34, and sellers have regained the initiative.
Looking deeper, the technicals paint a story of indecision tilted in favor of the bears. Trend indicators have started to roll over: while the average directional index still reflects some underlying trend, sellers are asserting more control, evidenced by the negative divergence between positive and negative directional movement lines. The weekly MACD is flattening, signaling momentum has fizzled as price hugs its moving averages—with all short- and medium-term EMAs nestled around the current price. Oscillators underscore the risk: RSI is hanging precariously below the midpoint, neither oversold nor primed for a bounce, and other short-term signals echo that stalling sentiment. If OKB can hold above $50 and muster a close above $54.75, hope for a bullish reversal lives on; but a break beneath monthly support at $49.34 risks an extended fall, potentially inviting a steep correction as long liquidations and fresh shorts gather steam. Right here, I’m cautious—momentum is lacking, and unless bulls show real resolve, the path of least resistance remains down.
Uniswap (UNI) Price Analysis
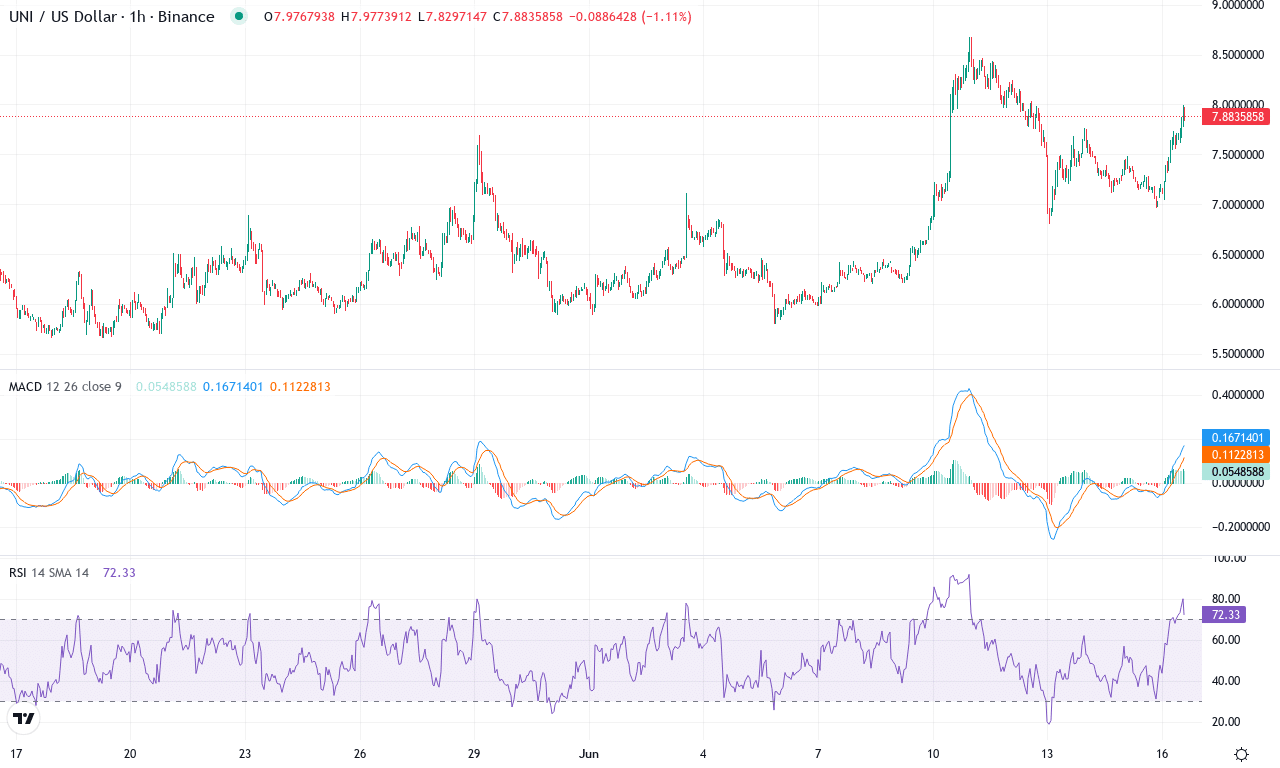
| Crypto | Close | 1W% | 1M% | RSI | ADX | MACD | CCI 20 | UNISWAP(UNI) | $7.88 | 24.54% | 29.92% | 59.6 | 36.0 | 0.40 | 89.21 |
|---|
After a bruising six-month slide, Uniswap (UNI) is roaring back to life, notching an impressive 29.9% monthly gain and a staggering 24.5% surge just this past week. The mood in UNI’s market has done a complete 180, as heavy resistance failed to hold back the bulls and buyers are stampeding above major moving averages. Right now, UNI is trading just under $7.88, practically kissing the monthly high and leaving the doldrums of the $5.66 lows in the rearview mirror. This breakout momentum follows months of profit booking and long liquidations—now, with both technicals and trader sentiment aligning, it feels like Uniswap could become one of this quarter’s comeback stories. I admit, seeing UNI recover after such punishing volatility gives me a sense of vindication for staying patient; there’s something special about watching a blue-chip DeFi name retake center stage.
Diving into the technical outlook, all signs point to a meaningful trend reversal. The directional movement indicators are strong: trend strength is clearly elevated, with momentum oscillators pointing decisively higher and the MACD showing fresh positive convergence that we haven’t seen since UNI’s last meaningful rally. RSI is now well north of 70—usually a red flag for overbought conditions, but when paired with a surging ADX and aggressive price action, it often signals the kind of brute-force bullish sentiment that can melt resistance levels. UNI has also reclaimed all major exponential moving averages and is holding firmly above its mid-term pivots, adding further conviction to the uptrend. For scenario planning: if UNI bulls can clear resistance at $8.68, it’s wide open toward the $9–$10 zone, where the next psychological battles await. But caution: if sellers push back and the price reverses below support around $7.20, we could see a sharp pullback toward $6.16, risking an extended fall back into the prior consolidation range. Either way, with volatility surging and momentum swelling, UNI’s next move will be anything but dull—keep your stops tight and your eyes open.
Navigating Crossroads Ahead
Pepe shows signs of corrective pressure, while OKB flirts with its monthly support zone. Meanwhile, Uniswap’s upward momentum hints at more potential gains if resistance gives way. As traders assess these mixed signals, focus shifts to whether the current volatility will lead to trend confirmation or reversal. Keep a close eye on upcoming sessions for decisive moves.