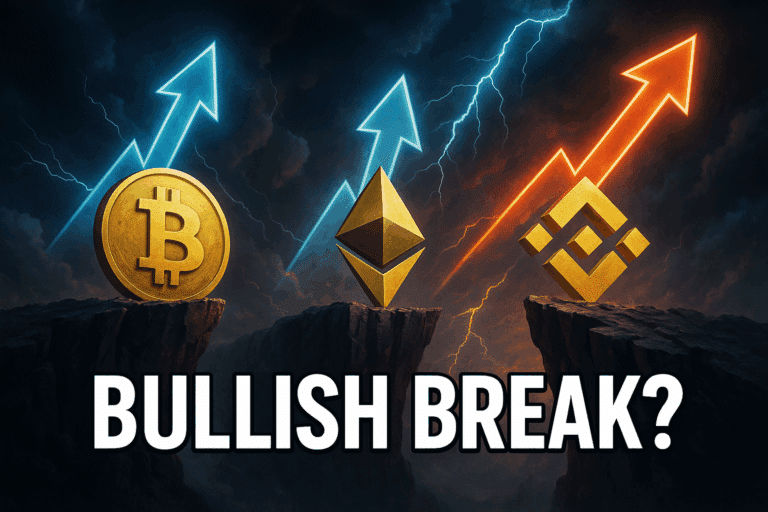
Quant And Zcash Bulls Charge Major Resistance Zones As Explosive Momentum Meets Pivotal Breakout Triggers
Quant and Zcash have both unveiled explosive momentum, with Quant rallying 23% this month to test key resistance near $120, and Zcash rebounding from recent lows to hover above crucial levels at $50. Market dynamics are stirring as institutions circle back, yet both assets find themselves at a technical crossroads with resistance pressing down. The question looms: can the bullish momentum propel a breakout, or are we on the brink of a corrective pullback? Let’s break down the technical setup across the board.
Quant (QNT) Price Analysis
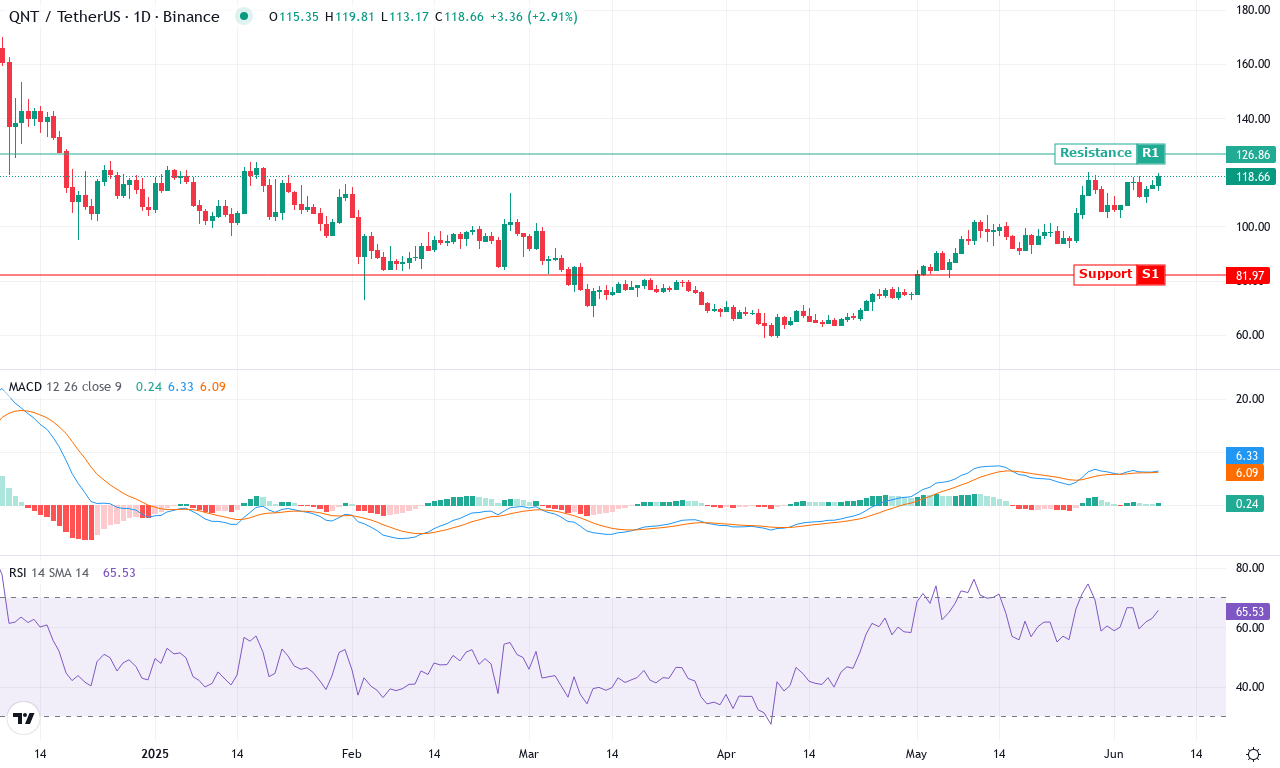
| Crypto | Close | 1W% | 1M% | RSI | ADX | MACD | CCI 20 |
|---|---|---|---|---|---|---|---|
| QUANT (QNT) | $117.60 | 9.04% | 23.14% | 64.7 | 32.9 | 6.24 | 89.87 |
After a blistering 23% rally this month, Quant (QNT) is finally waking from prolonged slumber, surging off its monthly lows near $90 to press against a major resistance at $120. The past week’s 9% pop signals a resurgent appetite among bulls, and the broader macro picture is coming alive—three-month returns above 50% hint at renewed institutional demand. But with price now sitting atop its monthly range and volatility swelling, we may be approaching a pivotal moment. Personally, after months of seeing QNT grind sideways, this sort of explosive follow-through is exactly what I live for.
Diving into the technicals, trend indicators confirm the momentum shift: directional trend strength is robust, and the weekly MACD is not only positive but building steam, which typically precedes a continuation rally. Momentum oscillators—especially the RSI and Stochastics—are leaning bullish but not quite stretched enough to scream overbought. Price action is well above all key exponential moving averages—bulls have the wind at their backs. All signs point to a breakout, but with QNT perched just beneath the $120–$127 resistance zone (and $126.86 as a pivotal intermediate level), any rejection here could spark volatile profit-taking. If buyers manage to blast through $127, the next target shines at $146, with price action potentially magnetized toward $190 on fresh institutional flows. On the downside, a sharp sell-off could see QNT tumble back to $101 or even test $98 support. As always, volatility cuts both ways—keep stop losses tight and remember: you’re not in the red until you sell.
Zcash (ZEC) Price Analysis
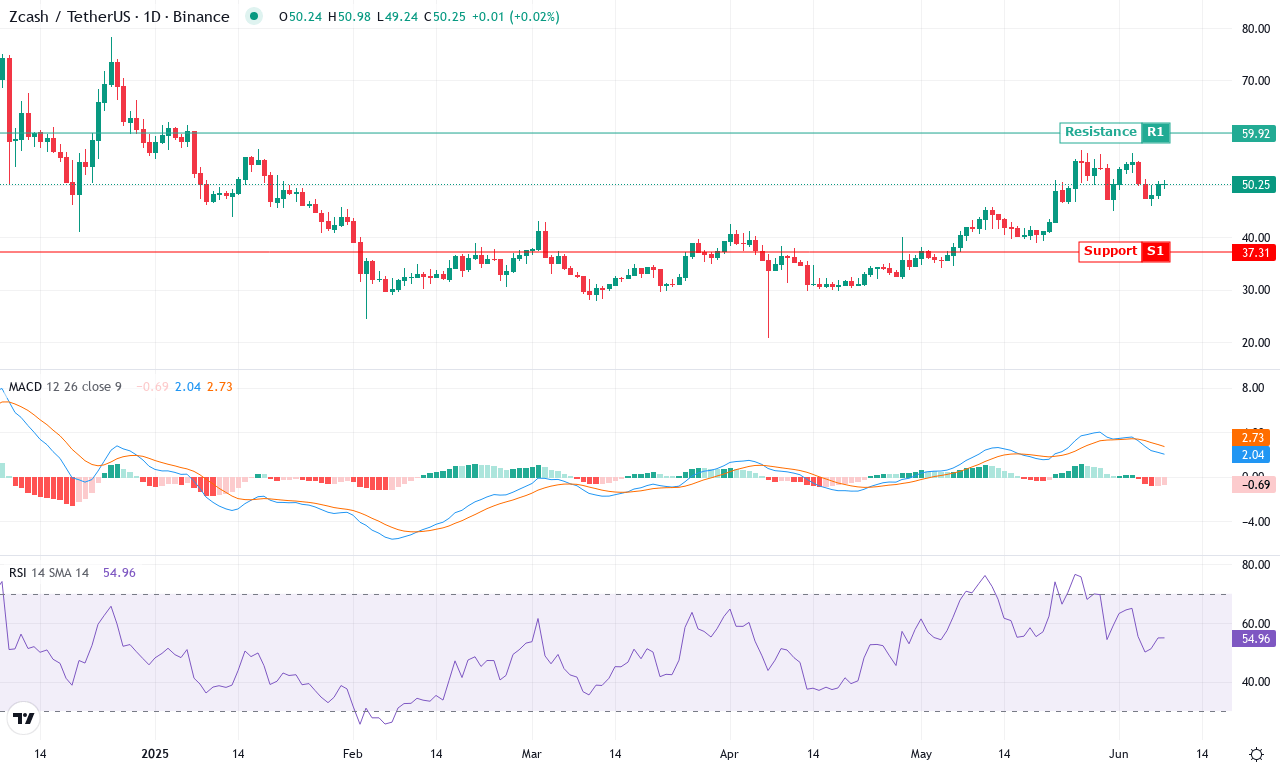
| Crypto | Close | 1W% | 1M% | RSI | ADX | MACD | CCI 20 |
|---|---|---|---|---|---|---|---|
| ZCASH (ZEC) | $50.10 | -0.16% | 19.29% | 54.6 | 29.3 | 2.03 | 3.83 |
After a blistering 19% monthly rally that saw Zcash rebound from a low near $39 to a monthly high at $56.79, the privacy-focused coin is now holding ground just above $50. Recent short-term consolidation comes on the back of an exceptional three-month run—up nearly 68%—but the six-month stats hint at turbulence, with ZEC still down over 14%. Despite this volatility, the bullish tide appears undiminished in the bigger picture: year-over-year performance displays Zcash more than doubling, a pace that’s simply too exciting for bears to ignore. As we approach the upper end of its recent trading band, market tension is rising—if ZEC pierces through resistance at $56.80, it could spark another wave of buying. I’ll admit, if we see that breakout, I’ll be strapped in for the ride.
Delving deeper, Zcash’s technical setup continues to flash bullish momentum—even as price action weaves through a tangle of nearby moving averages. Trend indicators like the ADX still register strength, while positive directional readings outpace the negative, signaling that buyers retain control. The MACD lines remain firmly above their signals and are expanding, a classic sign of an active uptrend and perhaps even an acceleration in momentum. Oscillators, including RSI, hover in the mid-range—suggesting there’s fuel left in the tank and ZEC is neither overbought nor exhausted. Support around the $47 level, reinforced by the 50-day EMA, should contain any sharp dips, while psychological resistance near $60 is in focus. If bulls can clear this area, the technical outlook suggests a clean shot toward $70. However, failure to break higher risks an extended fall back toward $44, where more aggressive dip buyers may emerge. For now, all signs point higher, but as always—keep your stops tight in this market.
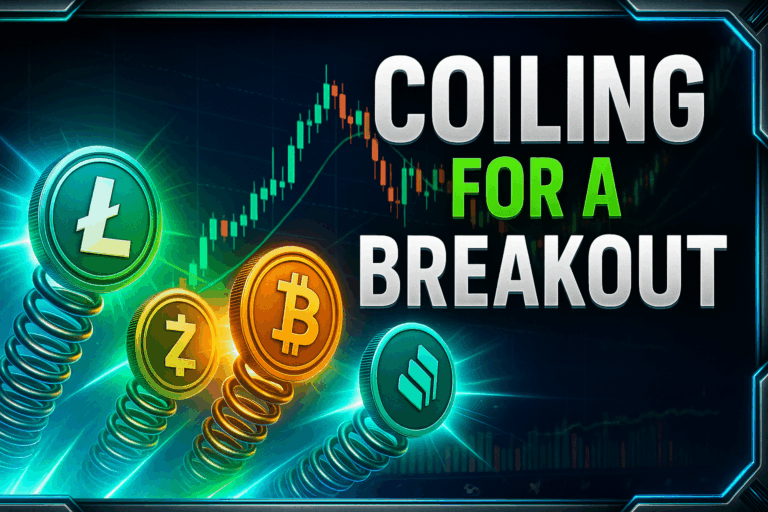
Will Quant and Zcash Break Through?
Quant approaches the $120 resistance with renewed vigor, while Zcash holds steady above $50. Sustained bullish momentum is crucial for breaking these barriers; failure may signal a near-term pullback. As both coins hover at pivotal junctures, traders should watch for confirmed breakouts or signs of momentum waning.