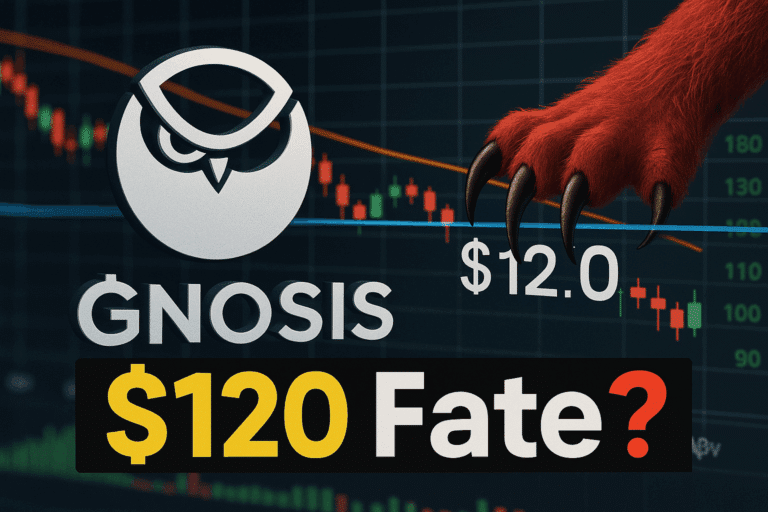
Quant Bulls Circle Multi-Month Highs as $120 Barrier Faces Its Biggest Test Yet
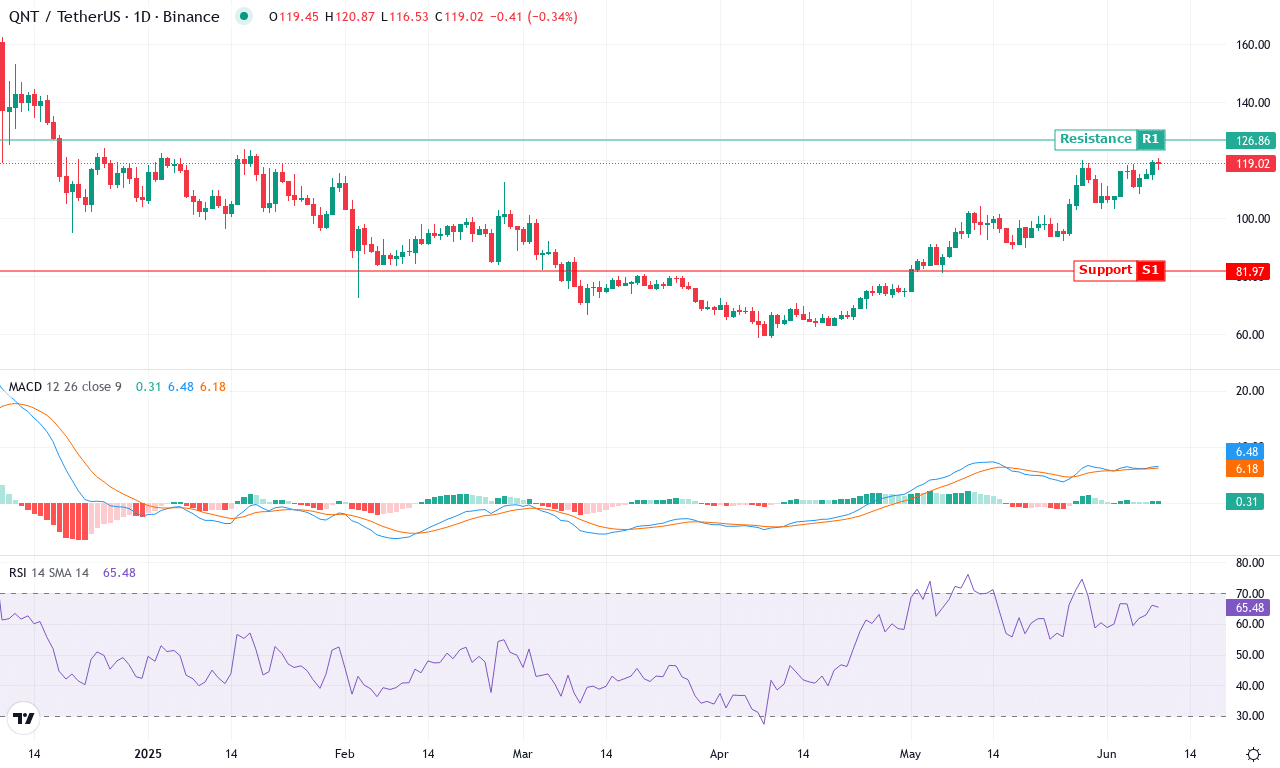
Quant’s impressive 25% surge this month has it testing a critical multi-month high at $120, a level that holds considerable psychological significance for traders. With the price pressing against the upper echelons of its recent range, investors are watching closely to see if bullish momentum can persevere or if profit-taking will reign. Will we witness a sustained rally, or are headwinds brewing? Let’s take a closer look at the signals behind the move.
Quant (QNT) Price Analysis
| Crypto | Close | 1W% | 1M% | RSI | ADX | MACD | CCI 20 |
|---|---|---|---|---|---|---|---|
| QUANT (QNT) | $119.23 | 11.86% | 25.37% | 65.8 | 33.1 | 6.50 | 106.45 |
After surging a stellar 25% in the past month, Quant (QNT) is cementing its reputation as one of crypto’s comeback stories of the quarter. The relentless climb from a monthly low near $89 to an eye-catching $120 high has clearly invigorated both swing traders and long-term participants. Recent price action shows strong hands are in control: weekly performance is robust, and the year-to-date advance is impressive even as some altcoins lag. With QNT now pressing against its multi-month highs and closing near the upper edge of its recent range, all eyes are on whether bulls can sustain momentum or if the market will succumb to profit-taking. Frankly, I’m excited—breakout attempts at these levels tend to ignite volatile upside runs.
Digging into the technicals, trend indicators paint a bullish backdrop. The ADX reading signals a powerful underlying trend, with positive direction overwhelming selling pressure. On the momentum front, the MACD remains firmly in bullish territory, and oscillators lean positive, although there’s a subtle hint that upside acceleration could cool if buyers hesitate above $120. Price is holding comfortably above all major moving averages, including short-term exponential and volume-weighted lines—always a vote of confidence for continuation traders. The next clear resistance lies at the monthly R3 level near $191, a level that could tempt institutional buyers if breached. If QNT falters and profit booking hits, expect a corrective move toward $101–$106, where several moving averages and a recent pivot zone converge. But unless a steep correction appears and invalidates the bullish structure, the overall technical outlook suggests the path of least resistance is still up. I wouldn’t underestimate this rally—if bulls can chip away at $120 and trigger FOMO, Quant could accelerate toward fresh yearly highs in dramatic fashion.
Will $120 Bend or Break?
Quant’s rally remains resilient as it tests the critical $120 mark, with Bulls eyeing a breakout. Should buying pressure persist, a move beyond this threshold could catalyze further gains. However, a failure to conquer this resistance may signal temporary consolidation. Traders should monitor volume levels to gauge the strength of this potential shift.