Solana, PEPE, and Bittensor Teeter on Pivotal Momentum Shift After Prolonged Slide
Solana, PEPE, and Bittensor have been flirting with recovery after a month marked by repetitive declines, as each hovers near crucial support levels. This week has seen slight upward movement, reigniting hopes of a rebound, yet technical indicators paint a picture of uncertainty. Will emerging momentum shift from weakening resistance to renewal, or are recent gains a final gasp before another slide? Let’s dive into the technical landscape for clues from the charts.
Solana (SOL) Price Analysis
| Crypto | Close | 1W% | 1M% | RSI | ADX | MACD | CCI 20 |
|---|---|---|---|---|---|---|---|
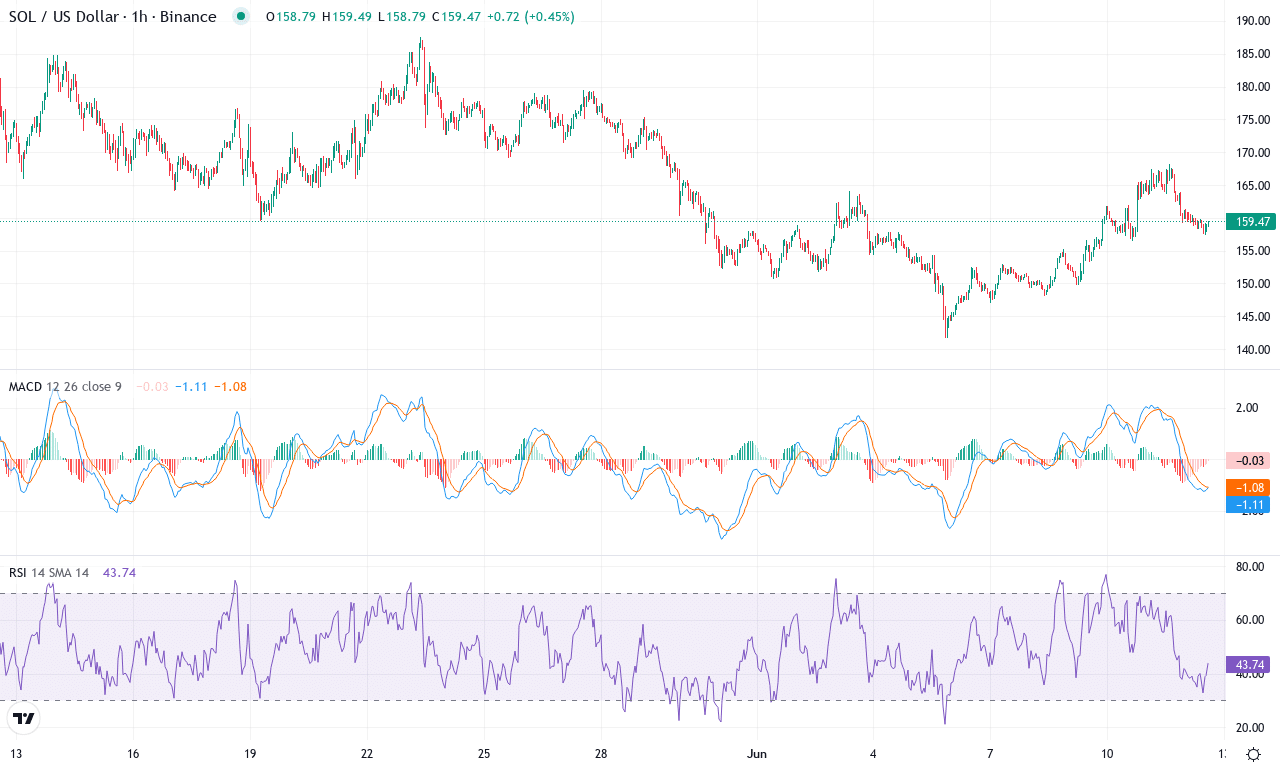
| SOLANA(SOL) | $158.78 | 3.59% | -8.87% | 48.9 | 18.6 | -1.50 | -16.19 |
After a volatile spring where Solana sprinted nearly 29% higher in the past three months, the tide has shifted. June has delivered a bruising blow, with SOL shedding nearly 9% this month and printing a fresh low near $141. Yet, despite near-term stumbles, Solana’s year-long performance remains in the green—a testament to its resilience amid the sector’s shifting currents. The price action has coiled just above the $158 region, a psychologically charged round number and key zone after bulls managed to defend it through the recent selloff. The price is hovering around both its 10-day and longer-term moving averages, sitting precariously at a juncture where momentum could snap back—or unravel further. Frankly, I’m feeling the suspense: a decisive move here could set the tone for Solana’s summer.
Technically, all eyes turn to trend indicators: the ADX signals robust (even swelling) trend strength, yet the negative directional index shows that sellers are in control. The weekly MACD and Awesome Oscillator have sunk into negative territory, underlining a period of bearish momentum—momentum that started heating up last week and is now flashing caution for bulls. Still, oscillators like the RSI hover in the high 40s, suggesting we’re not yet fully oversold—there’s room for a further slide if the $150-$155 support gives way. On the flip side, clearing resistance near $182 (and reclaiming the 20- and 30-day moving averages) could spark a relief rally up toward $208 or even test the monthly high at $187. But if sellers regain control and push SOL below $142, risks tilt toward a steep correction, with downside open toward the $136 zone. My takeaway: stay nimble and respect the volatility—Solana is at a crossroads, and conviction must be earned.
Pepe (PEPE) Price Analysis
| Crypto | Close | 1W% | 1M% | RSI | ADX | MACD | CCI 20 |
|---|---|---|---|---|---|---|---|
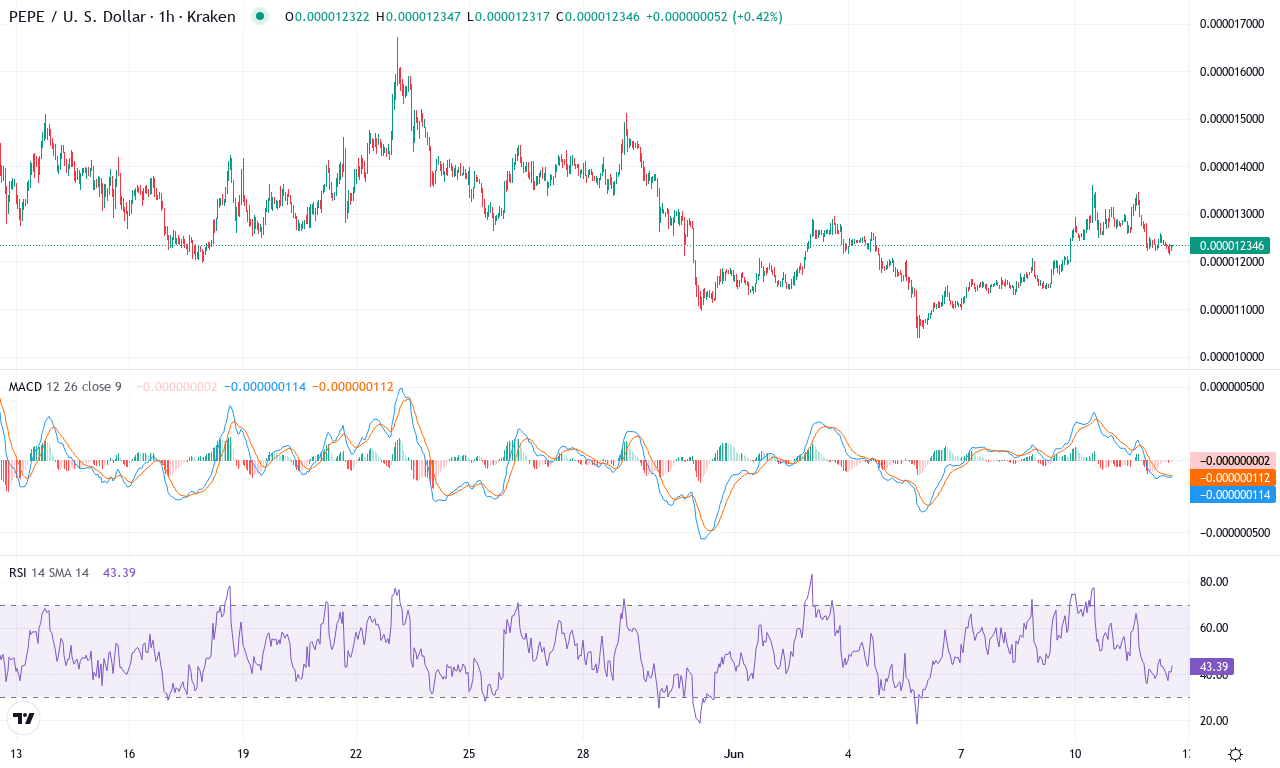
| PEPE(PEPE) | $0.00 | 3.92% | -9.71% | 50.9 | 25.7 | 0.00 | -13.60 |
After soaring nearly 84% over the last three months, Pepe has reversed sharply, shedding nearly 10% this month and underperforming amid increased volatility. Its current price action is clinging to the $0.0000123 handle—still well above the monthly low but showing signs of indecision after bears took control. This abrupt pivot is underscored by the staggering 50%+ decline in the past six months, weighing on sentiment and reminding traders that meme coins like Pepe thrive on momentum but can turn on a dime. With resistance clustering near the recent monthly high at $0.0000167 and buyers struggling to build a solid floor above the critical psychological $0.000012 level, the next several sessions will prove decisive.
The technical outlook suggests trend strength is still palpable, as trend indicators point higher and signal that buyers have yet to fully surrender. The directional index and trend oscillators indicate an ongoing battle, with bullish momentum cooling but not entirely exhausted. The weekly MACD is showing flattening momentum, hinting at possible stalling, while oscillators such as RSI hold just above the 50 region—neither overbought nor oversold, but losing the relentless drive of prior months. Should bulls manage to lift Pepe above $0.000013, the path toward the $0.0000167 major resistance could open; failure here risks an extended fall toward the $0.000011 pivot and possibly revisiting the monthly low at $0.0000104. I’d be careful at these levels—momentum can snap back fast in these markets, but with volatility surging and profit-taking a threat, tightening stops is never a bad idea. If the tide turns, expect fireworks; otherwise, buckle up for more turbulence.
Bittensor (TAO) Price Analysis
| Crypto | Close | 1W% | 1M% | RSI | ADX | MACD | CCI 20 |
|---|---|---|---|---|---|---|---|
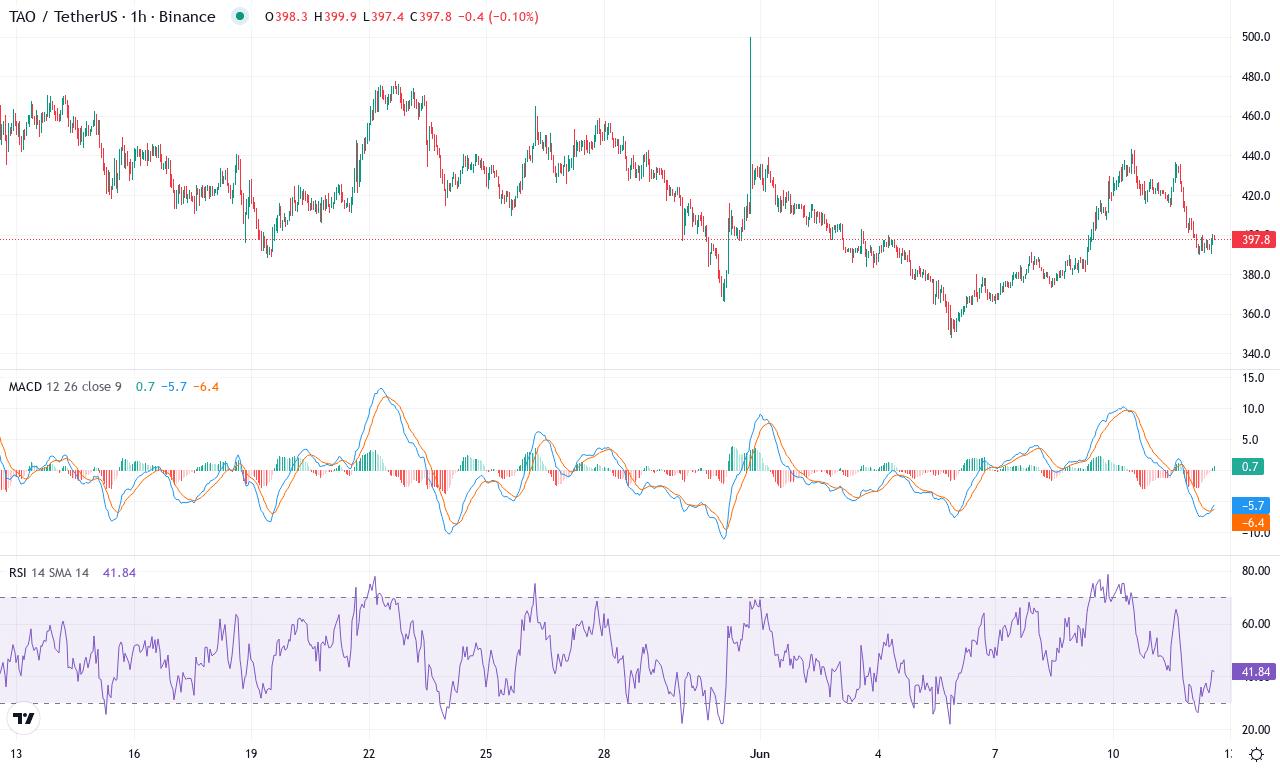
| BITTENSOR(TAO) | $398.60 | 4.59% | -12.68% | 49.0 | 17.3 | -1.35 | -30.40 |
After a volatile month that saw Bittensor (TAO) swing between a high of $500 and a low of $347.4, the token is currently consolidating near $398.6. Recent action has been anything but bland—TAO exploded nearly 67% over three months, only to retreat nearly 13% in the last month, highlighting a classic tug-of-war between aggressive bulls and resurgent sellers. The token’s weekly reversal, with a dip of over 4%, suggests profit-taking is dominating after a stellar Q1, yet the broader narrative remains one of resilience; even after a 31% six-month drawdown, yearly gains sit comfortably in the green. If you’re feeling whiplash, you’re not alone—TAO has delivered a masterclass in crypto volatility, but the technicals are aligning for a decisive move from this sideways range.
Digging into the chart, trend indicators still point to energetic bullish momentum—an exceptionally strong ADX above 17 reveals the ongoing trend. Meanwhile, the positive directional index maintains the upper hand, outpacing the negatives and showing bulls haven’t surrendered control. Still, momentum is flagging: the MACD line hovers below its signal and the AO just turned negative, hinting that bullish momentum is stalling. While price holds above all major moving averages—the 10, 20, 30, and 50 EMAs all bunch tightly around current levels—a failure to reclaim $423 resistance would expose TAO to a test of the $374–$346 support zone. Oscillators offer mixed signals: with RSI holding mid-range, the market is neither overbought nor oversold, but the CCI softens and Bollinger Band power is fading. Here’s the play: If bulls can reclaim the $423–$424 region, next resistance looms at $507 and $583. If sellers dig in, risks extend toward a messy, capitulation-style drop back to $346 or lower. Personally, I’m watching this chart with anticipation; a convincing breakout from here could ignite another wild run—don’t blink.
Can the Bounce Gain Traction?
Solana is challenging its nearest resistance, while PEPE nears a potential reversal zone. Bittensor’s recent uptick raises questions about sustained recovery. Should momentum increase, breakthroughs are possible; if not, the current gains may falter. Traders should stay alert to these key levels, as the coming days will be telling for direction.