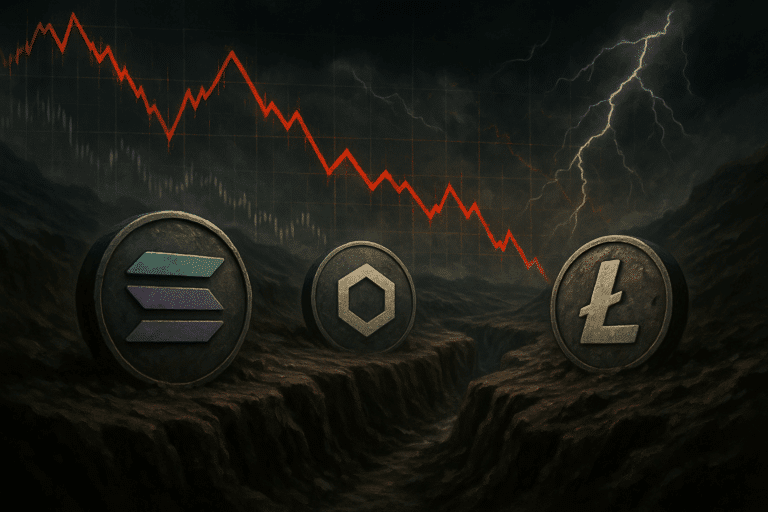
Sui And Solana Bulls Lose Grip As Crucial Support Zones Face Fierce Retest
After enjoying strong gains earlier this year, Sui and Solana are now testing critical support levels as recent downturns threaten their upward momentum. Sui has retreated 17% this month, hovering above important $3.00 psychological support, while Solana teeters around $157.26, facing increased selling pressure. At these technical crossroads, the tightly contested battle between bulls and bears raises questions: Will buyers step in to defend, or will the market yield to deeper corrections? Let’s break down what the key indicators are suggesting now.
Sui (SUI) Price Analysis
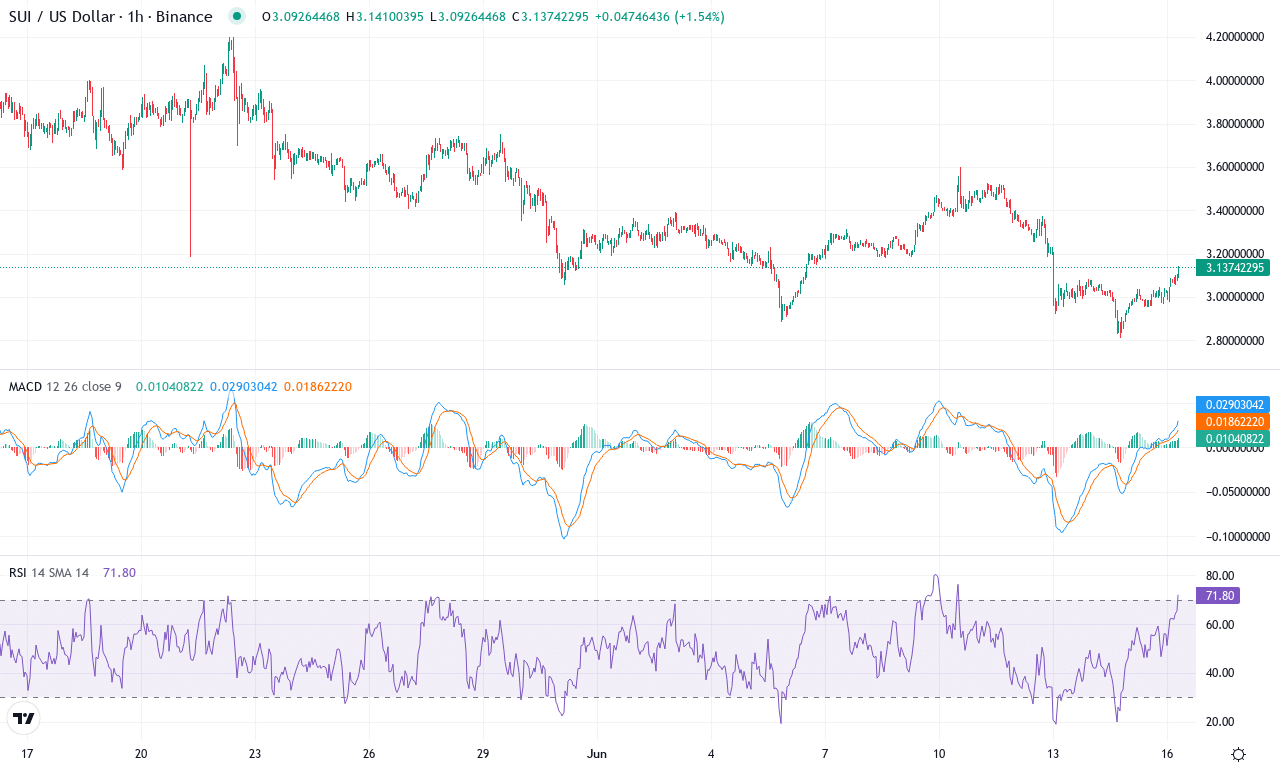
| Crypto | Close | 1W% | 1M% | RSI | ADX | MACD | CCI 20 | SUI(SUI) | $3.13 | -2.81% | -17.15% | 44.4 | 28.3 | -0.11 | -79.43 |
|---|
After a blistering first quarter that saw Sui surge over 30% in three months, the momentum has soured quickly—this month’s steep 17% drop feels like a cold splash of water for anyone who chased the prior rally. Sui now trades just above $3.13, forming a precarious perch above its monthly low near $2.81. Short-term price action is choppy: last week’s modest retreat hints at waning bullish appetite as profit-taking surges, erasing some of the earlier exuberance. From a macro perspective, the project’s stellar 232% yearly gain still looms large, yet recent volatility gives pause—the technical outlook suggests buyers may be losing their grip, at least temporarily. I find myself torn; Sui’s long-term story is compelling, but near-term risks of further correction can’t be ignored.
Digging into the technicals, trend indicators flash a mixed picture. The ADX reading underscores strong overall trend strength, but with the negative directional component now outpacing the positive, bears are starting to regain control after a period of relentless ascent. The weekly MACD has rolled over and now slips beneath its signal, while momentum oscillators confirm the narrative—RSI sits near the midpoint but is tipping lower, and secondary oscillators point to a loss of buying pressure. The price is consolidating between key moving averages: Sui sits just above its 100-day exponential moving average, but only a whisker below the 50-day, signaling indecision. Immediate support emerges at the psychologically crucial $3.00 mark, with deeper protection near the monthly low; if sellers break that zone, risks of an extended fall towards the $2.70s intensify. On the upside, bulls must clear resistance around $3.50 to invalidate the bearish reversal thesis—if that level gives way, I’d expect another run to $4.00 and beyond. For now, all eyes are on this tug-of-war at $3.00—a test of nerves for traders and strong hands alike.
Solana (SOL) Price Analysis
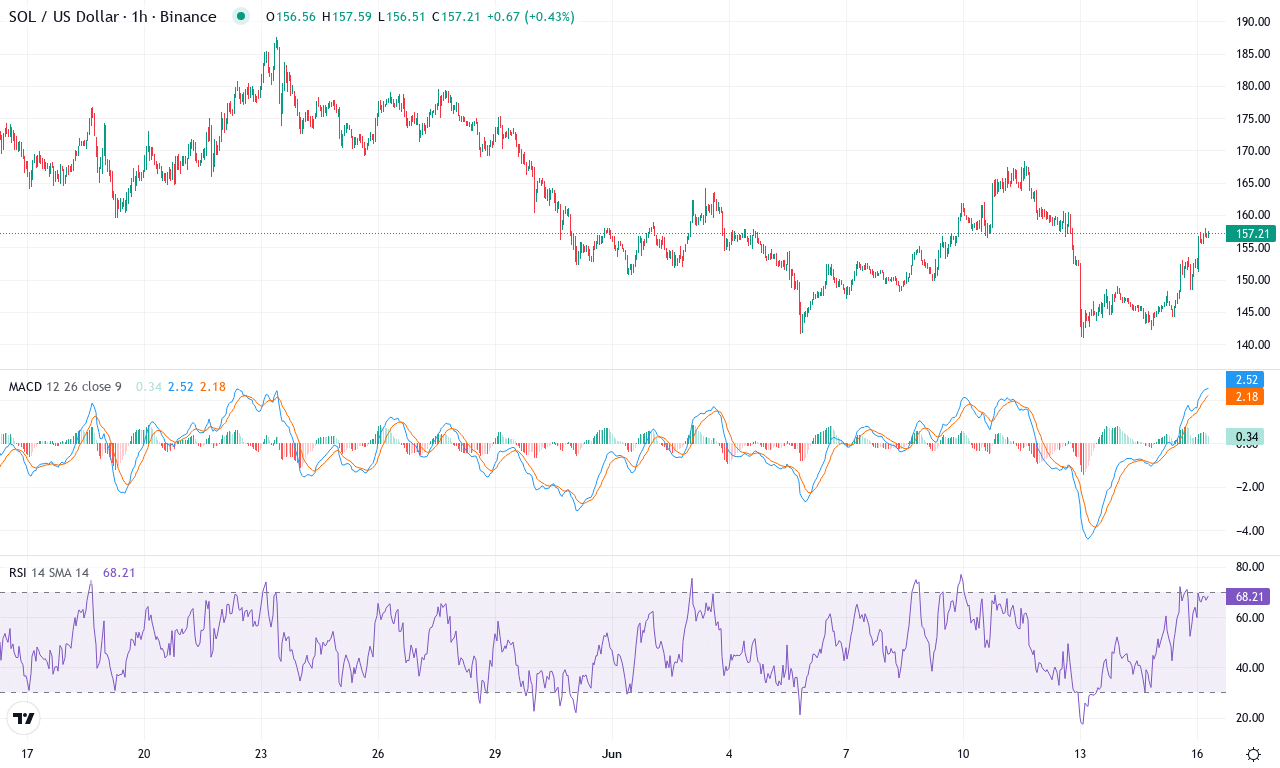
| Crypto | Close | 1W% | 1M% | RSI | ADX | MACD | CCI 20 | SOLANA(SOL) | $157.26 | 3.11% | -6.07% | 49.9 | 17.4 | -2.66 | -3.88 |
|---|
After a red-hot start to 2024, Solana has been showing signs of fatigue this month, with a steep pullback from its $187.57 high and a recent monthly performance that’s turned negative by over 6%. This comes on the heels of strong gains over the last quarter—up nearly 23%—but the past six months have been brutal, with nearly 30% shed from its value. The coin is currently trading at $157.26, hugging key moving averages and suggesting a market searching for direction. Despite its relative outperformance year-to-year, the technical outlook suggests that bullish momentum is waning and a pivotal moment is approaching. If sellers manage to push the price back below the crucial $150 psychological support, risks of an extended fall increase—SOL could quickly become more vulnerable to long liquidations and sharp drawdowns. But as someone who’s watched Solana’s volatility for months, I can’t help but feel a sense of suspense building at these crossroads.
Peering under the hood, trend indicators have weakened—the ADX has softened, showing a less decisive market, while negative directional signals are outmuscling the positives, hinting that sellers are regaining control. The MACD has dipped into negative territory, and its histogram is deepening the downside bias, confirming a bearish momentum swell. Additional oscillators, including a cooling RSI and a CCI retreating from elevated conditions, reinforce the idea of fading bullish steam but fall short of signaling true oversold relief. Solana’s price is clinging to support at its 10-day and 20-day exponential moving averages; lose this footing, and the $140 area—its monthly low—comes squarely into play as the next key defense. On the upside, only a decisive reclaim of $175–$180 would invalidate the bearish thesis and open the door for another push at this year’s highs. Until then, traders should buckle up—volatility is bound to return, and the next move could be explosive in either direction. If Solana clears those resistances, I’ll be right there celebrating—if not, you’ll find me watching for a buy-the-dip opportunity.
Testing the Bulls’ Resolve
Sui remains precariously perched above $3.00, a level that may define its short-term trajectory if breached, while Solana’s struggle at $157.26 underscores potential for further downside pressure. The immediate outlook depends on buyer activity at these crucial junctures. Traders should watch for decisive support defenses to signal sustainability of previous gains, or brace for potential pullbacks if these levels fail.