Sui And Solana Hover Near Critical Lows As Bears Threaten Deeper Downside Move
Sui and Solana are catching the spotlight this week as both find themselves teetering near critical lows amidst an unrelenting wave of bearish pressure. With Sui surrendering a hefty 26% in recent weeks, and Solana giving up over 14%, investors are fervently assessing the risk of further downside. As these digital assets flirt with key support zones, traders are on high alert, contemplating whether the current slide could deepen or if a surprising reversal might be on the horizon. Time to examine whether momentum can carry through in this turbulent market landscape.
Sui (SUI) Price Analysis
| Crypto | Close | 1W% | 1M% | RSI | ADX | MACD | CCI 20 | SUI(SUI) | $2.91 | -16.56% | -26.19% | 38.9 | 29.0 | -0.14 | -134.54 |
|---|
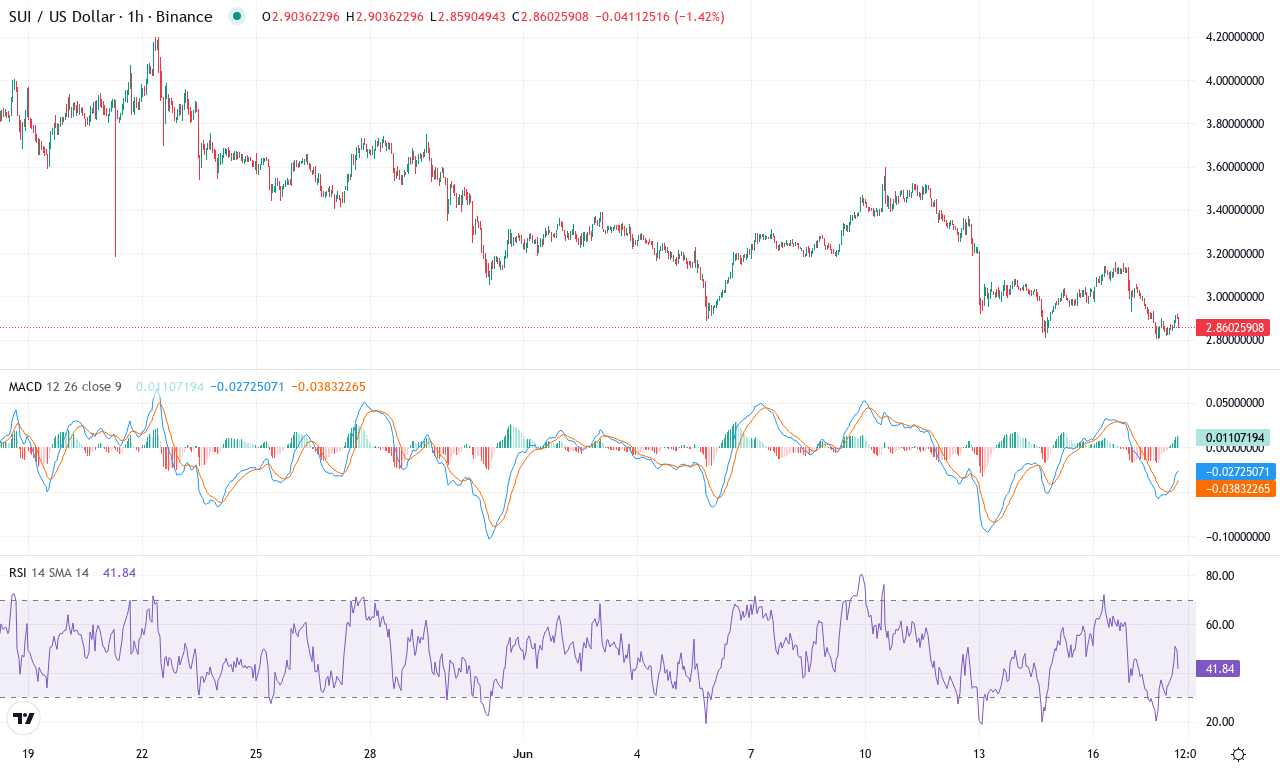
After a scorching start to the year, Sui has hit a wall amid steep correction pressures, dropping an eye-watering 26% this month and surrendering over 16% just this past week. Yet, it’s remarkable to see that even after this bruising slide, Sui still boasts a massive 226% gain over the past year—a testament to its underlying narrative strength and previous speculation fever. Price now clings to $2.91, finding itself squeezed between a monthly low near $2.80 and recovery hopes that eye the upper pivot resistance around $4.00. This bout of volatility has traders on edge, as many early longs who caught the rally are now forced to weigh the risk of a deeper retracement versus the potential for a rapid bounce-back if broader optimism returns.
Technically, exhaustion is setting in. Despite a robust trend indicator (ADX) still showing strong trend conditions, the direction has shifted in the bears’ favor, with negative momentum building and the MACD line sliding further below its signal line—a classic warning that bullish momentum is draining out, and risks for an extended fall are increasing. Oscillators have swung from overbought back to neutral, with RSI deflating toward the mid-40s and the commodity channel index plunging deep into negative territory, signaling that sellers have seized control for now. Price is now drifting below its short-term moving averages—another red flag for trend traders—but hovers precariously close to the $2.80 support zone. If Sui manages to hold this line and shake off the bears, we could see a tactical bounce toward the $3.50 region, and if bulls miraculously reclaim $4.00, all bets are off for another volatility surge. But a failure to defend current support risks a slide toward $2.30 and potentially a cascade of long liquidations. I’m cautious in this spot—the risk-reward is getting interesting, but the technical outlook suggests more pain unless buyers step in decisively.
Solana (SOL) Price Analysis

| Crypto | Close | 1W% | 1M% | RSI | ADX | MACD | CCI 20 | SOLANA(SOL) | $149.07 | -9.69% | -14.08% | 43.8 | 16.2 | -3.46 | -78.21 |
|---|
Solana is reeling after a steep drop this month, down more than 14%, with bears clearly in control and the token failing to reclaim momentum. Following an impressive multi-month run, SOL has been hammered by profit-taking and a broad loss of risk appetite, dragging price back toward $149 support. Weekly performance also paints a bleak picture, showing close to a 10% slide amidst heightened volatility. It’s been brutal watching bulls lose their grip; this is a classic example of a red-hot trend encountering heavy resistance and cooling off fast. With the current pivot zone holding near $161, and price now decisively below most major short-term moving averages, the technical outlook suggests caution is warranted—especially if the recent lows around $141 start cracking.
Technically, Solana’s trend indicators are flashing warning signs: trend strength is fading fast, visible in both the slowing ADX and a bearish MACD setup, with the histogram deep in negative territory. Oscillators are echoing the pullback as momentum has crumbled and the RSI is hovering close to neutral—neither oversold nor offering any sign of strong bullish divergence yet. SOL is under all key exponential moving averages from 10 to 100 days, while price action remains capped by resistance at $162 and $182, creating a heavy ceiling. The real pressure point sits around $141; if that fails, a deeper correction toward the next psychological level near $115 can’t be ruled out. On the flip side, a clean break and close back above $162 might finally signal a bottoming process, setting up a relief rally toward $182. Until that materializes, I’m sitting on my hands—it’s not a loss until you sell, but discipline is critical while sellers are getting squeezed and volatility whipsaws the unwary.
Will Support Hold?
Sui finds itself skimming past critical support, while Solana inches closer to a potential breakdown if bearish momentum prevails. For bulls to regain control, a bounce from current levels is essential, otherwise, further declines are likely. As traders navigate this critical juncture, all eyes remain on volume and any emerging reversal signals.