TAO And OKB On Edge As Bulls Defend Make-Or-Break Support Amid Momentum Shift
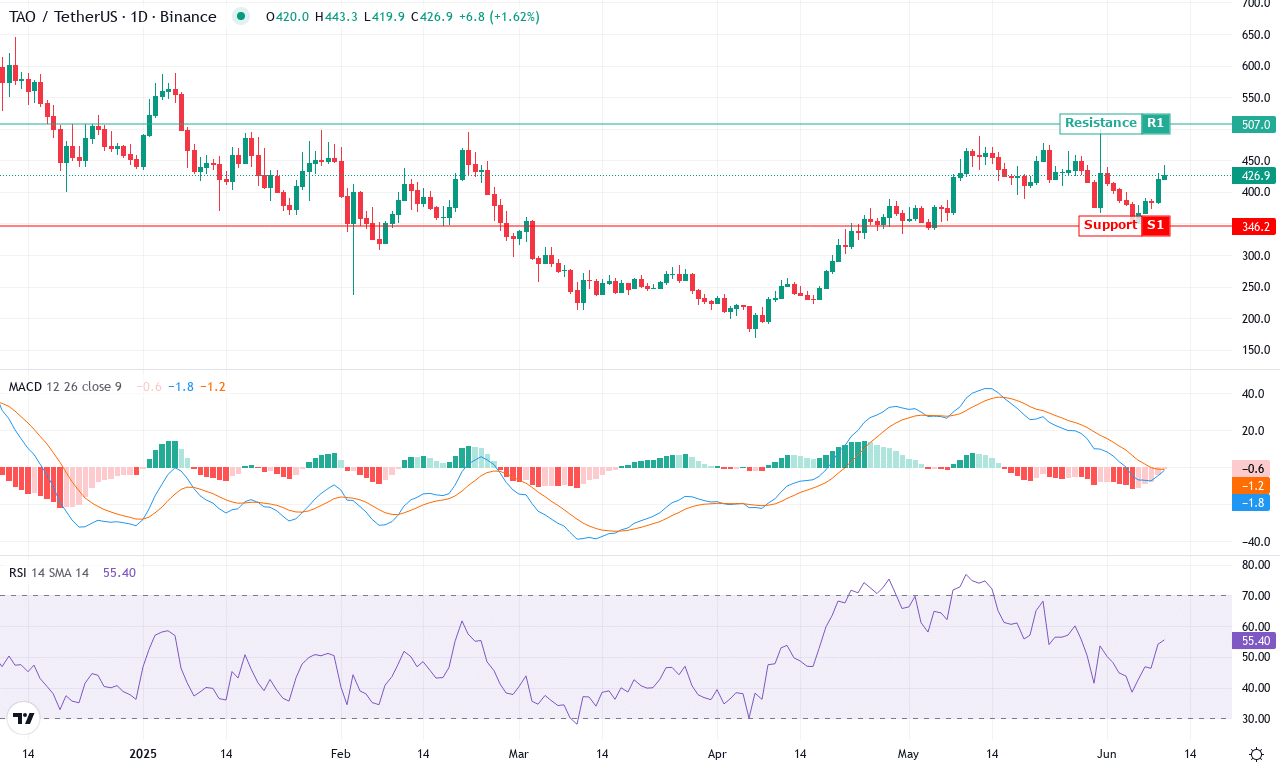
Bittensor (TAO) has been on a wild ride, surging over 65% before hitting a stormy patch with a recent 7% drop. As TAO tests a key support level at $423, the market is at a technical crossroads. Can bulls defend this zone and rekindle momentum, or are deeper retracements on the horizon? Let’s break down the signals to understand where TAO might head next.
Bittensor (TAO) Price Analysis
| Crypto | Close | 1W% | 1M% | RSI | ADX | MACD | CCI 20 |
|---|---|---|---|---|---|---|---|
| BITTENSOR (TAO) | $431.00 | 6.74% | -7.21% | 56.2 | 18.2 | -1.53 | 49.29 |
After a blistering 65% surge across the past three months, Bittensor (TAO) has hit significant turbulence. The past week’s -7% drop has traders on edge, particularly given the deep retracement from its monthly high of $500 down to $431 at Friday’s close. Price action shows that a steep correction is underway as TAO slips closer to its major support around $423. With macro sentiment still favorable for AI-linked assets, the technical outlook suggests this drawdown could be a healthy reset—though the market’s recent rejection near $500 leaves me cautious in the short term. If bulls want to regain control, they’ll need to defend $423 with conviction, or risk a further slide toward $346 where the next critical support sits.
Digging into the technicals, trend indicators are still flashing strong—an elevated ADX underscores that the prevailing trend is robust, yet there’s now clear evidence of momentum fading. The MACD line has just ticked below its signal, hinting at rising bearish momentum, while oscillators like the weekly RSI are cooling but not yet in oversold territory. Importantly, price has slipped below its short-term exponential moving averages, putting extra pressure on bulls to step in before sellers trigger a steeper correction. Key resistance looms overhead at $507, and a bounce from $423 would keep the bullish thesis alive, with upside potential back toward $583 if momentum rebounds. However, a close below $423 could unleash more volatility and risks an extended fall to $346—the bears’ target. I’ll admit, I’m watching this level with some nerves; if history is any guide, TAO loves to punish late sellers just as the ETH crowd piles in. Stay nimble—this market could snap back as violently as it broke down.
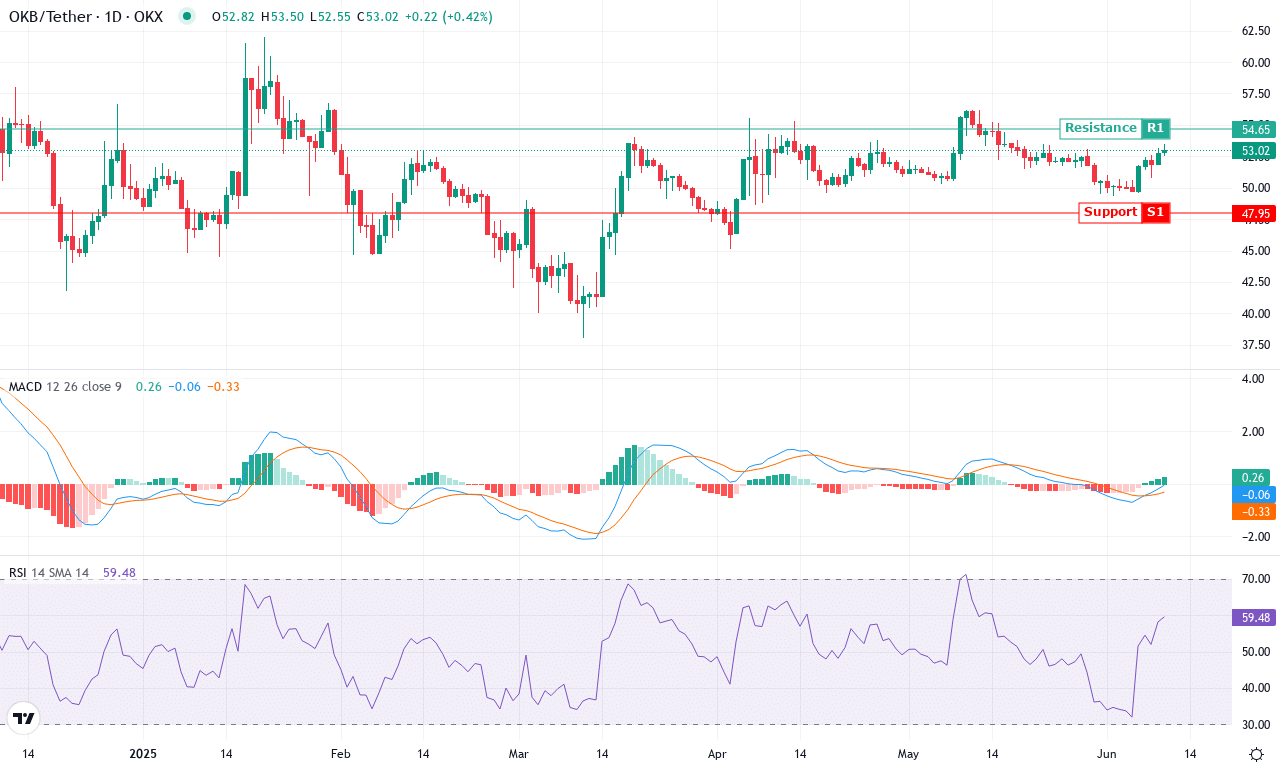
OKB, meanwhile, is experiencing its own battle, posting a modest bounce but still embroiled in a broader monthly decline. With demand and bearish pressure in a tug-of-war around the $52.87 mark, the token faces pivotal levels that could determine its short-term fate. Will a bullish push regain the upper hand, or are we on the cusp of a larger correction? Time to dive into the charts for answers.
OKB (OKB) Price Analysis
| Crypto | Close | 1W% | 1M% | RSI | ADX | MACD | CCI 20 |
|---|---|---|---|---|---|---|---|
| OKB (OKB) | $52.87 | 5.38% | -5.71% | 58.7 | 12.4 | -0.07 | 100.17 |
After a volatile month for OKB, the token finds itself trading at $52.87, staging a modest 5% bounce this week yet still nursing a 6% monthly decline. Following a 27% rally over the past three months, recent price action suggests that bullish fervor is cooling—momentum has clearly stuttered from the highs near $56. OKB’s technical outlook reflects this shifting tide; the monthly sell-off signals profit booking, with sellers probing the lower end of the recent range. However, buyers are not fully out of the fight: the recovery off $49.34 hints at a resilient support base willing to absorb sell pressure, at least for now. If this floor collapses, risks of an extended fall become real, but for the moment, the token is teetering at a crossroads—demand and fear are wrestling for control.
Diving deeper, trend indicators portray a market still favoring the bulls but with waning momentum. The ADX above 12 with a firm positive tilt tells me the prevailing uptrend has legs, yet that weekly MACD shift—back toward the signal line—warns the rally is losing punch. Oscillators show a tug-of-war: while the RSI hovers near a neutral zone, stochastics and the momentum gauge both reveal a flattening trajectory, suggesting enthusiasm is slipping. Price continues to trade above the cluster of 10-, 20-, and 30-day EMAs, but not by much, so a decisive move is coming. OKB sits just beneath interim resistance at $54.65 (the monthly pivot); a break above here could unlock a run toward $58.77 next. But if bears force a close below $51.10—the EMA100 and the support shelf—look out for a steep correction back toward $47.95 or even $45.37. I wouldn’t sleep on this inflection: whichever side wins here might dictate OKB’s trend for weeks to come.
Can Bulls Keep Control?
As Bittensor (TAO) clings to its critical $423 support, the coming days will be crucial; a sustained defense here could revive its bullish momentum, while failure might lead to deeper corrections. OKB’s fight near $52.87 reflects a fragile balance—should bulls overcome, a short-term uptrend may emerge, but a slip could herald a broader decline. Traders should remain vigilant, as the next movements will set the stage for both coins’ trajectories.