XRP, BNB, and OKB Brace for Turbulence as Bulls Fight to Reclaim Key Support
In a period marked by mixed sentiment across the crypto landscape, XRP, BNB, and OKB are bracing for a potential shake-up as key support levels hang in the balance. XRP’s recent stumble from $2.48 to $2.16 amplifies traders’ anxiety just as BNB faces a pivotal moment around the $650 mark, while OKB manages a quiet climb amid sector-wide uncertainty. The stakes are high as each asset deals with its unique set of pressures, leading bulls to a critical juncture where every move counts. Will resilience hold or will we see a shift in the tide? Let’s break down the technical setup across the board.
XRP (XRP) Price Analysis
| Crypto | Close | 1W% | 1M% | RSI | ADX | MACD | CCI 20 | XRP(XRP) | $2.16 | -4.93% | -9.38% | 44.4 | 13.9 | -0.03 | -44.54 |
|---|
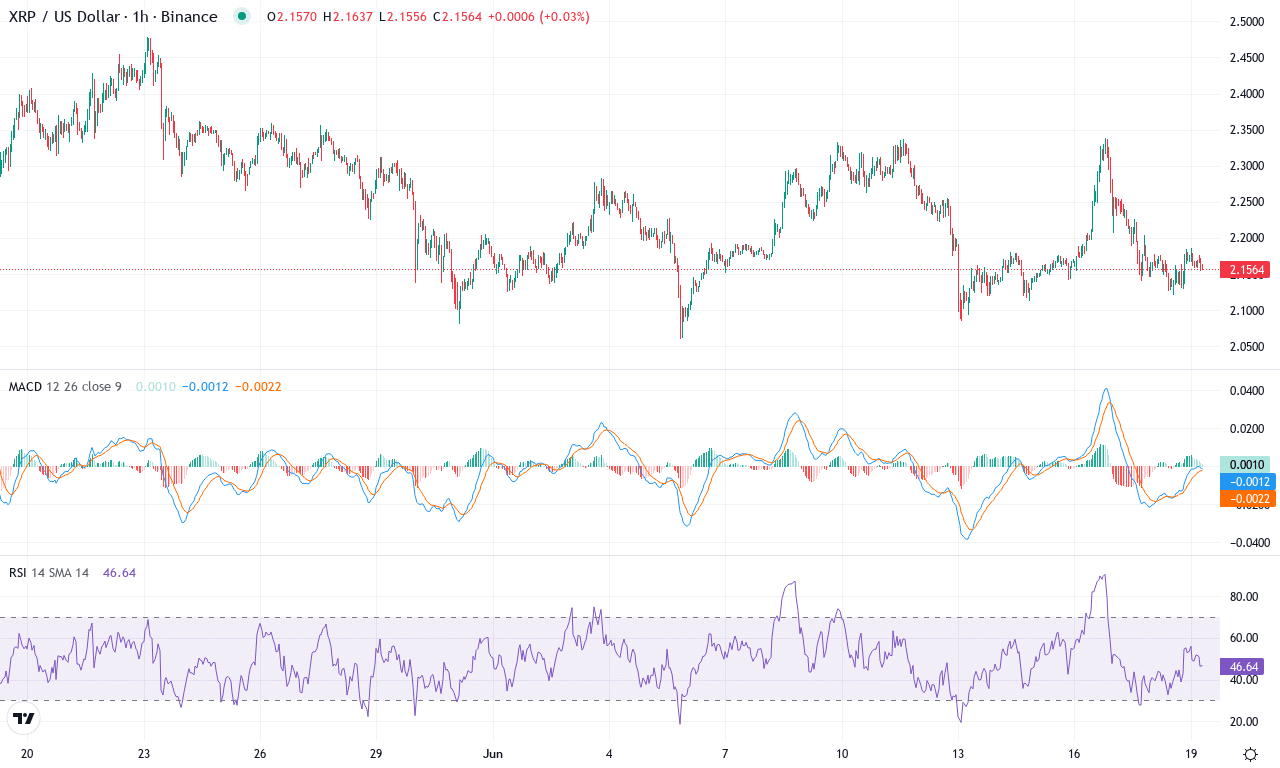
After a disappointing month, XRP finds itself in the grip of a deeper correction, shedding nearly 9% as bearish pressure escalates. The token recently slipped from its monthly high near $2.48 toward current levels at $2.16, mirroring wider market uncertainty—even though its yearly gains remain jaw-dropping at almost 340%. The inability to hold above key moving averages and the snap below psychological support at $2.20 have traders on edge; it’s not often you see momentum dissolve this quickly after a long run. While short-term oscillators are flagging oversold territory, the mood is tense, and XRP faces stiff resistance above, leaving bulls on the defensive.
Drilling into the technicals, trend indicators continue to deteriorate: the positive directional index is losing its bite, while trend strength is waning, suggesting bulls are ceding ground. The weekly MACD shows early hints of convergence but remains below its signal line—confirming sellers still dominate the scene. RSI has eased toward more neutral levels after a recent plunge, with oscillators calling for caution rather than capitulation. XRP trades below its major exponential moving averages (10 through 50 days), cementing a bearish short-term bias, and the classic pivot at $2.30 stands as the immediate resistance that must be reclaimed to spark any sort of rebound. If sellers push prices beneath the $2.10 zone, risks extend toward a steeper correction approaching $1.95, last seen as the monthly low. If, however, bullish sentiment stages a comeback and XRP can recapture $2.30, the door reopens for a challenge toward $2.53 and beyond. I’ll be closely watching volume spikes and any shift in momentum—until then, patience and defensive stops are the order of the day.
BNB (BNB) Price Analysis
| Crypto | Close | 1W% | 1M% | RSI | ADX | MACD | CCI 20 | BNB(BNB) | $645.30 | -3.31% | -0.71% | 45.3 | 16.8 | -1.61 | -89.56 |
|---|
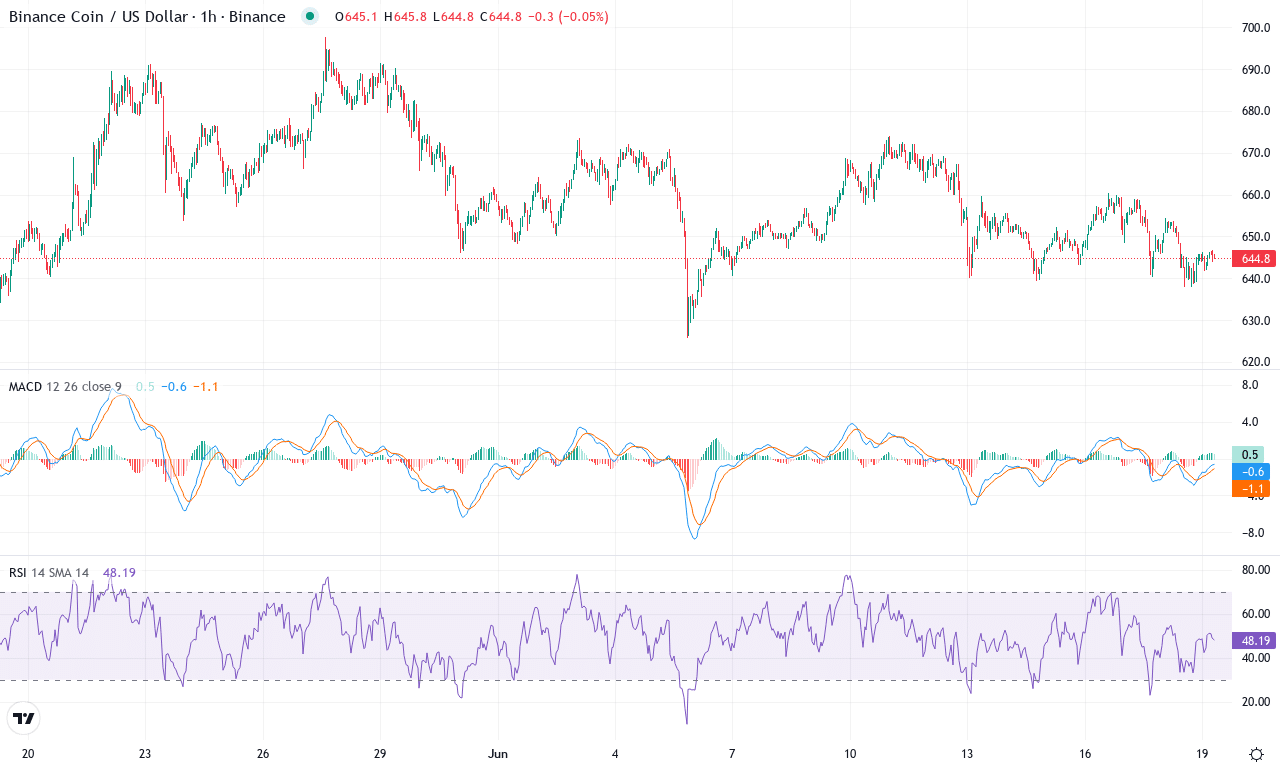
After a sharp run-up in the first half of the year, BNB is now struggling to maintain altitude, closing the week at $645.3 after a subdued monthly performance. The coin has cooled off from its recent high of $697.7, moving into a consolidation phase where bears and bulls are locked in a tug-of-war near the $650 zone. While the asset remains up nearly 10% year-over-year, cracks are showing: a dip of 3% on the week, coupled with a minor lag over the month, suggests that the momentum which once fueled its ascent is waning. Having witnessed explosive rallies before, I can’t help but sense that BNB is approaching a crossroads—one that could redefine its trajectory for Q3 2024.
Diving into the technical picture, several trend indicators hint at bullish momentum losing steam. The average directional index shows a strong underlying trend, but the negative directional movement has overtaken the positive, often a precursor to corrective moves. The MACD lines have crossed into bearish territory, with the histogram turning down—a sign that buyers are losing their grip. Oscillators show fatigue: RSI is holding in a neutral band, but other short-term readings suggest choppy conditions, with Bollinger Band pressure indicating BNB is hugging its lower volatility edge. Price action is hugging the short-term moving averages, clinging just above key support at $638; a break below could open the door for a retest of the $595–$600 support zone. Conversely, if bulls can absorb recent profit-taking and launch a strong bid above $661, the next resistance looms near $710, and a true breakout would force sellers to capitulate. As volatility stirs, I’m watching closely—the coming week could hand us a defining move, and I want to be on the right side when it does.
OKB (OKB) Price Analysis
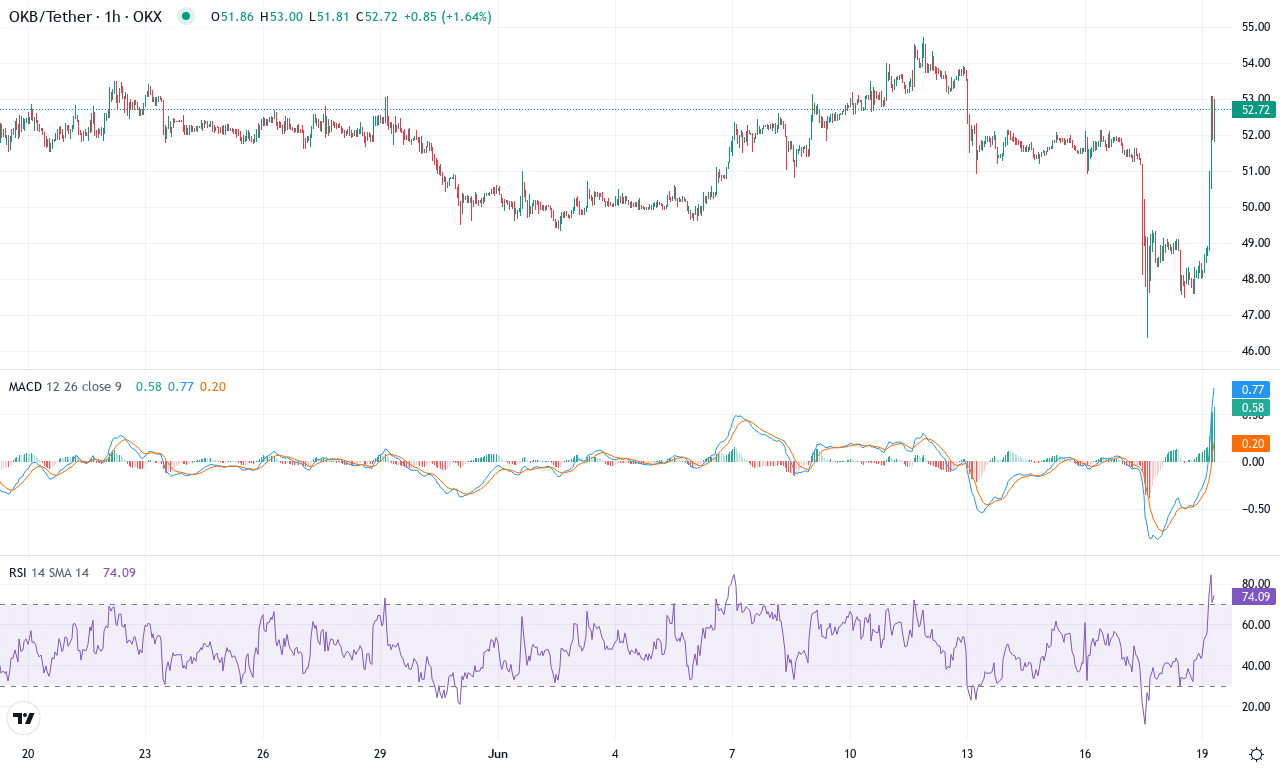
| Crypto | Close | 1W% | 1M% | RSI | ADX | MACD | CCI 20 | OKB(OKB) | $52.72 | -2.15% | 0.50% | 54.7 | 16.5 | -0.33 | 3.30 |
|---|
After a muted week for most majors, OKB stands out as it quietly inches higher, notching a modest monthly gain amid palpable sector-wide uncertainty. Even while the token slipped just over 2% in the past week, the broader picture shows resilience: OKB has racked up more than 14% returns in the last six months and is still clinging to its yearly uptrend. The latest price action reflects a market searching for conviction, with OKB ranging between $46.34 and $54.72 and closing near $52.72—right at a significant psychological zone. The technical outlook suggests neutral-to-cautious optimism: long-term trend indicators remain constructive, and I can’t help but feel a twinge of anticipation as the token teeters near key resistance, awaiting a catalyst to ignite momentum.
Diving into the technicals, the trend indicators are still pointing upward, albeit with signs of waning bullish momentum. The average directional index signals ongoing, but moderating, trend strength, while a recent negative crossover in MACD—despite holding above its signal line on the weekly view—warrants vigilance for a deeper pullback. Oscillators appear split: RSI hovers in the mid-50s, steering clear of both exhaustion and freefall, while shorter-term momentum measures like the Commodity Channel Index show OKB near overbought territory, hinting that the bulls are cautious but not exhausted. On the moving averages front, OKB is pinned above its major exponential lines (10, 20, 50, 100, even 200), reinforcing medium-term support at $51 and $50. If buyers can break through resistance between $54 and the monthly high at $54.72, the stage is set for a run at $58, the next clear upside target. Conversely, a decisive failure here increases the risks of a retest toward $48 or even $46. My sense: as long as OKB keeps its footing above $50, bullish arguments remain alive, but don’t blink—this range won’t hold forever.
Navigating the Path Ahead
XRP has momentarily steadied near $2.16, but sustained recovery requires a decisive move above its previous support at $2.48. BNB remains precariously perched around $650, needing bullish momentum to affirm its current trajectory. Meanwhile, OKB’s gradual ascent is watched for signs of broader sector strength. As these assets teeter near technical thresholds, traders should keenly observe volume and market sentiment for the next decisive move.