XRP, BNB, and SUI Coil at Crucial Levels as Volatility Teases a Major Break
XRP, BNB, and SUI find themselves at critical junctures as market volatility hints at a compelling shift. Recently, XRP has drifted near its recent lows, while BNB treads carefully just shy of its highs, leaving traders to ponder if momentum will reignite or falter. Meanwhile, SUI has slipped into a precarious position with fading bullish vigor. Will these digital assets break through their respective barriers, or is a broader correction on the horizon? Let’s break down what the key indicators are suggesting now.
XRP (XRP) Price Analysis
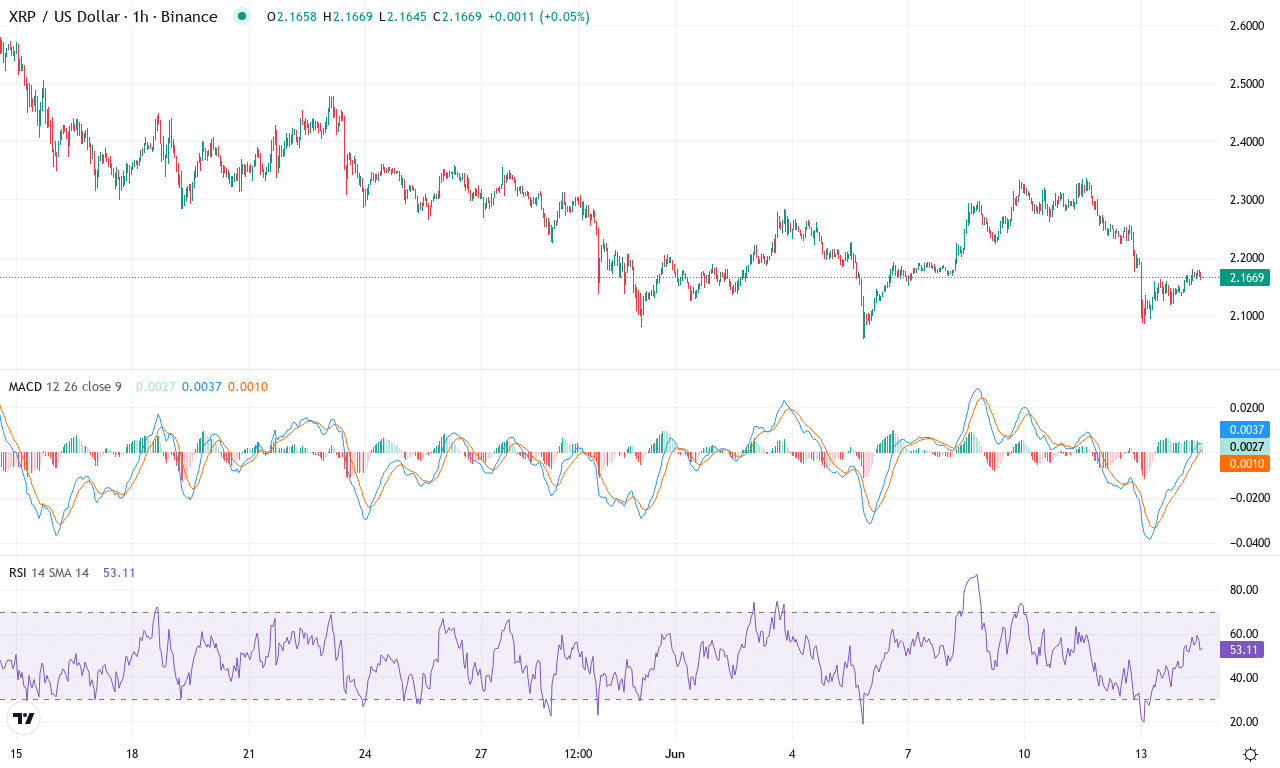
| Crypto | Close | 1W% | 1M% | RSI | ADX | MACD | CCI 20 | XRP(XRP) | $2.16 | -0.01% | -15.29% | 43.6 | 17.5 | -0.02 | -72.28 |
|---|
After an explosive run earlier this year, XRP finds itself weighed down by a tough month, dropping over 15% and slipping toward the lower end of its recent trading range. Despite spirited attempts to reclaim momentum, the price is currently hugging the $2.16 mark, noticeably closer to last month’s low of $2.06 than the exuberant high above $2.47. Short-term action is subdued, with this week posting negligible losses, underscoring a market in search of direction amid fading enthusiasm. The macro trend, however, remains broadly healthy, buoyed by a massive yearly gain—reminding traders that sentiment can pivot swiftly when volatility returns. But for now, XRP is at an inflection point: will the bulls muster the strength to spark a new leg higher, or are we staring down the barrel of a deeper correction?
Technically, trend indicators still point to an underlying bullish structure, yet momentum cracks are starting to show. The ADX remains elevated, confirming a robust trend is in play, but the gap between directional lines has narrowed as buying pressure ebbs and selling interest creeps in. The weekly MACD has been losing steam, now threatening to cross into negative territory, while oscillators like RSI are mid-range—adding to the sense of indecision but not outright bearishness. Price is riding atop its cluster of shorter-term moving averages but struggling to break free, with clear resistance looming at $2.30 and psychological barriers gathering at $2.50. If bulls punch through the $2.30 zone, a surge toward the monthly high near $2.48 is on deck. Otherwise, risks of an extended fall remain; losing hold of the $2.06 support could usher in a sharper, possibly sentiment-driven selloff. My nerves are tingling at this crossroads—whichever way XRP breaks, traders should buckle up for a volatility surge.
BNB (BNB) Price Analysis
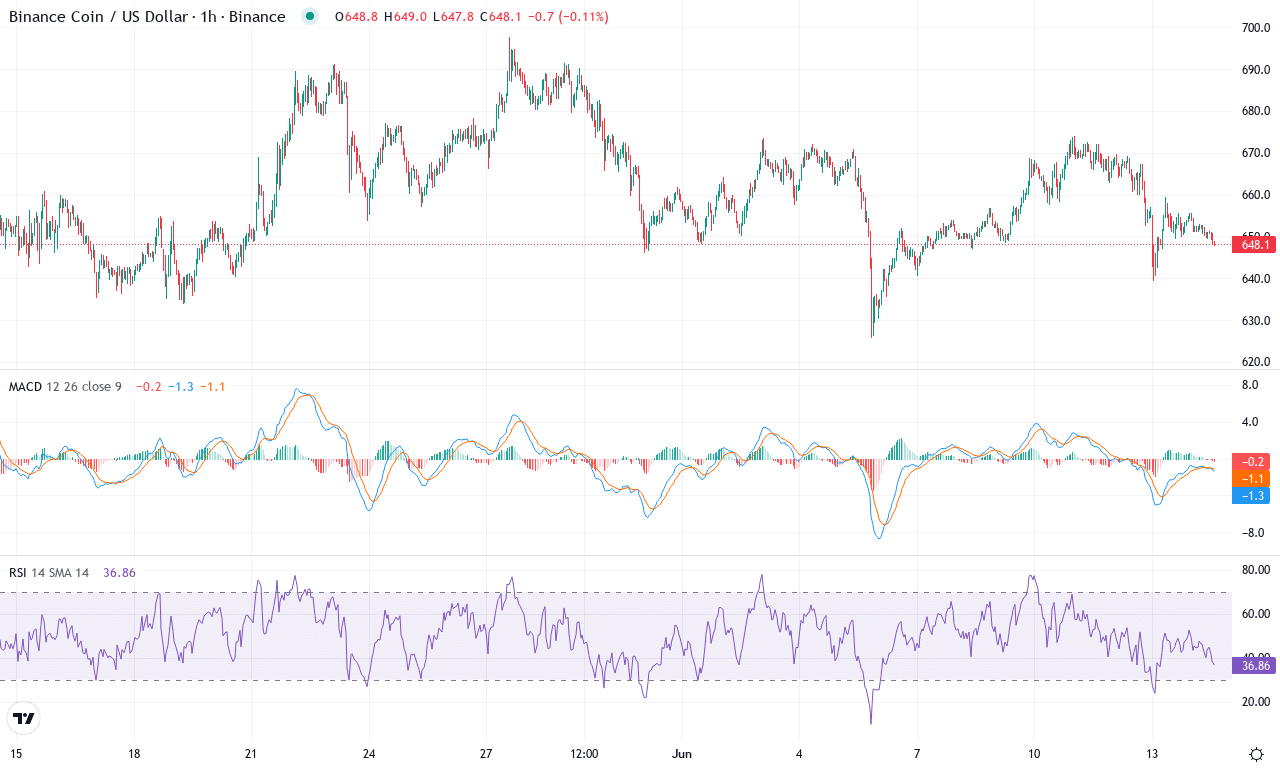
| Crypto | Close | 1W% | 1M% | RSI | ADX | MACD | CCI 20 | BNB(BNB) | $648.50 | 0.79% | -0.61% | 46.6 | 18.5 | 1.66 | -75.35 |
|---|
After a swift rise in the early part of the quarter, BNB finds itself pressing against a crucial zone, trading just off recent highs near $648.50. The past week was almost eerily flat after a brief run-up, leaving traders on edge for the next decisive move. Despite a modest monthly pullback of just over half a percent, broader performance metrics remain resilient—over the last year, BNB has notched strong cumulative gains, a testament to long-term accumulation and possible institutional demand. The technical outlook suggests a market in limbo: with momentum beginning to wane but no clear bearish reversal yet, BNB’s next move could set the tone for Q3. As a trader, this sideways standoff has me watching support and resistance levels tighter than ever; a convincing break is coming—question is, which way?
Diving deeper into the technicals, BNB faces a battle of trend strength versus momentum decay. Trend indicators hint at underlying bullish momentum—average directional index readings remain robust, and the positive directional indicator is still elevated, signaling that bulls maintain some control for now. However, oscillators paint a more cautious picture; the weekly MACD has lost much of its earlier acceleration, and the current histogram position warns of stalling momentum. RSI sits in neutral territory after pulling back from overbought levels, suggesting neither buyers nor sellers have full control. Price hovers just above the 50-day moving average and clusters close to mid-pivot levels—adding to the suspense as price action drifts between major support at $625 and looming resistance at $697. If bulls can muster enough conviction to break above $700, we could see BNB testing new all-time highs. But watch out: a bearish reversal from here risks an extended fall toward the $600–$620 support band. I’d be thrilled to see this coil resolve higher—just remember, inaction at these levels often preludes explosive moves. Stay sharp.
Sui (SUI) Price Analysis
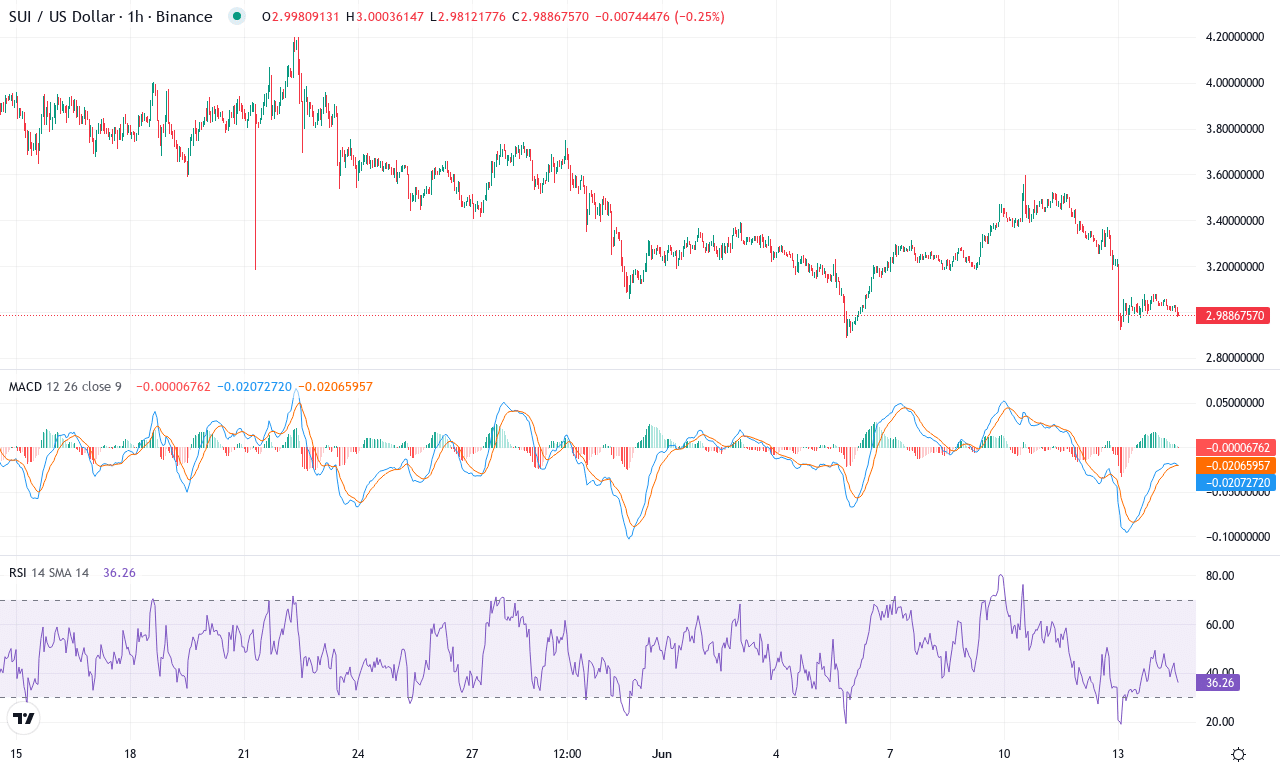
| Crypto | Close | 1W% | 1M% | RSI | ADX | MACD | CCI 20 | SUI(SUI) | $2.99 | -6.59% | -23.76% | 38.5 | 27.3 | -0.10 | -134.01 |
|---|
After a blistering rally earlier this year, Sui has hit the brakes hard, dropping over 23% for the month and sliding another 6.5% this past week. The mood has shifted from euphoria to caution as sellers have seized control, driving SUI close to its recent monthly low near $2.88. That’s a stark contrast to its meteoric year-long gains of over 200%. Price action analysis shows SUI stalling just below its main cluster of support around $3, raising my nerves as bullish momentum continues to slip away. While significant volatility is still in play, the swift pullback has forced traders to reckon with whether this is a brief correction or the start of a more extended decline. For now, the technical outlook suggests the bears are pressing their advantage and any hope for a bounce rests on a stabilization above current levels.
A closer look at the chart reveals a decisive shift in trend signatures—trend indicators point to weakening conviction, with the weekly MACD now tilting slightly negative and the gap to the signal line widening. Oscillators, including RSI hovering in the high 40s, flag waning bullish momentum, justifying why sellers are getting bolder. Support rests just below at $2.75; if that gives way, risks of a steep correction accelerate, with $2.30 emerging as the next critical floor. On the flip side, should bulls regroup and clear resistance near $3.50, upside momentum could quickly return with a possible sprint toward the $4 mark—a reclaim of lost territory that’d get me downright excited. Until then, the moving averages cluster overhead act as stiff resistance and the burden of proof lies squarely with the bulls. SUI is on the edge here: watch for a strong move soon, because whichever side seizes control will dictate the next chapter.
Crossroads for Crucial Levels
XRP teeters at support levels, and a failure to defend could spark further declines. BNB remains poised near its resistance, with potential gains hinging on sustained buying pressure. SUI’s waning momentum highlights its vulnerability unless confidence resurfaces. Traders should stay vigilant as these assets navigate pivotal points, with the next moves likely guiding the broader trend.