XRP SUI And LINK Teeter At Crucial Lows As Bears Squeeze Bulls To Breaking Point
XRP, SUI, and LINK are navigating treacherous waters as bears tighten their grip, pushing these tokens to critical lows. In recent weeks, XRP has slipped over 10%, while SUI and LINK tumble further, both facing their own pivotal levels. With bearish momentum resurgent and significant support zones under threat, the market finds itself at a technical crossroads. Could a reversal be on the horizon, or is a steeper decline imminent? Let’s take a closer look at the signals behind the move.
XRP (XRP) Price Analysis

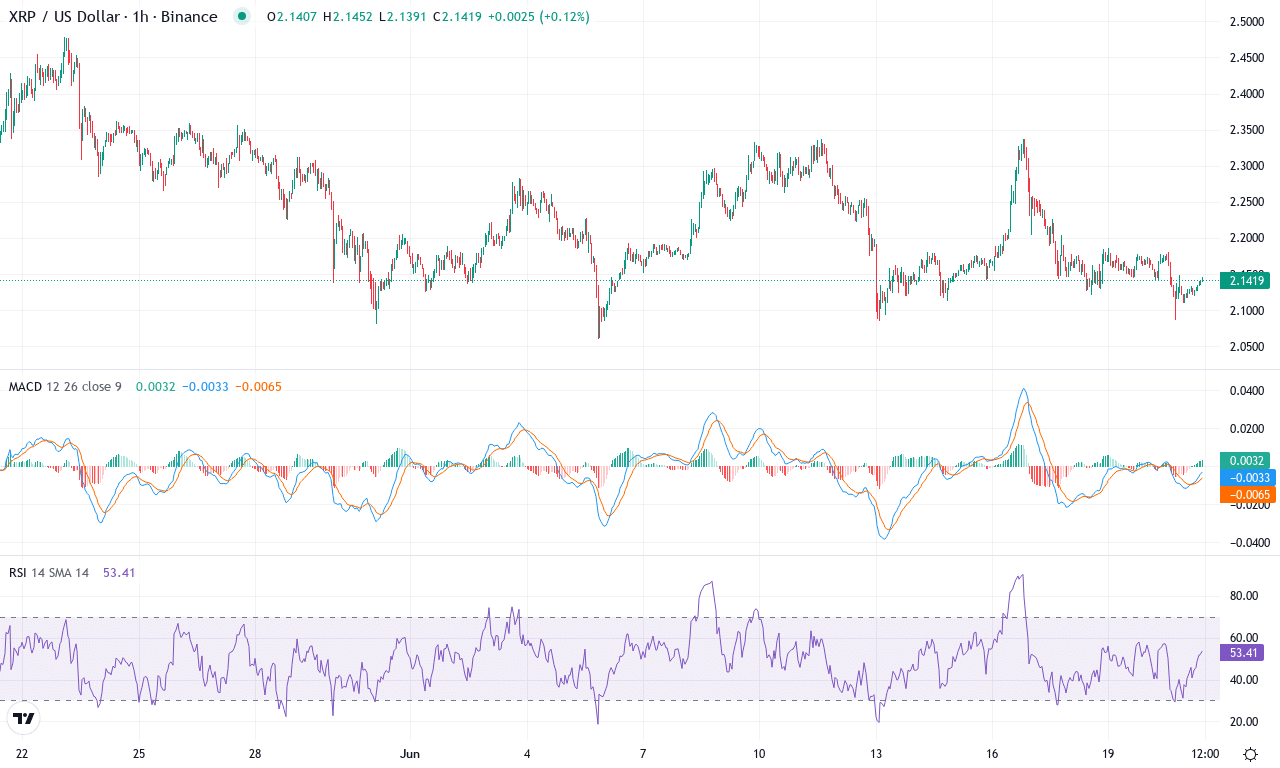
| Crypto | Close | 1W% | 1M% | RSI | ADX | MACD | CCI 20 | XRP(XRP) | $2.14 | -0.39% | -10.74% | 43.6 | 13.4 | -0.03 | -83.90 |
|---|
After a month marked by persistent downside pressure, XRP finds itself at a critical juncture. Following a hefty slide of over 10% on the month and nearly 1% this past week, the token is hovering just above its monthly low, sustaining bearish momentum. Longer-term gains from earlier in the year are fading, and the current technical outlook suggests that sellers are regaining control. Even though XRP boasts a remarkable 338% gain on the yearly timeframe—a number that might bring a tear to the eye for early longs—recent price action leaves little room for complacency. As XRP now holds around $2.14, traders are watching to see if bulls can engineer a reversal, or if this dip is the first act of a steeper correction.
Diving into the technical landscape, trend indicators point to weakening bullish conviction. The ADX registers in the teens, a clear sign of a waning trend, while a bearish push from the negative directional line over its positive counterpart underlines growing downside risk. The MACD on the weekly charts still clings to positive ground, but the daily MACD line has turned marginally negative—often a harbinger of further weakness if confirmed by additional daily closes. Oscillators echo this negativity, with RSI dipping into the low 40s and momentum readings remaining in the red. Price sits below most major moving averages and is threatening to break support near the $2.10 zone—a psychological line in the sand. If bears sustain pressure and XRP breaches this level, the next significant cushion lies closer to $1.95. However, should buyers recapture $2.30 and reclaim the 20-day moving average, I’d expect a relief rally targeting resistance near $2.53. All told, XRP faces a pivotal moment: a bounce here could stun the skeptics, but if support cracks, risks for an extended fall remain firmly on the table.
Sui (SUI) Price Analysis

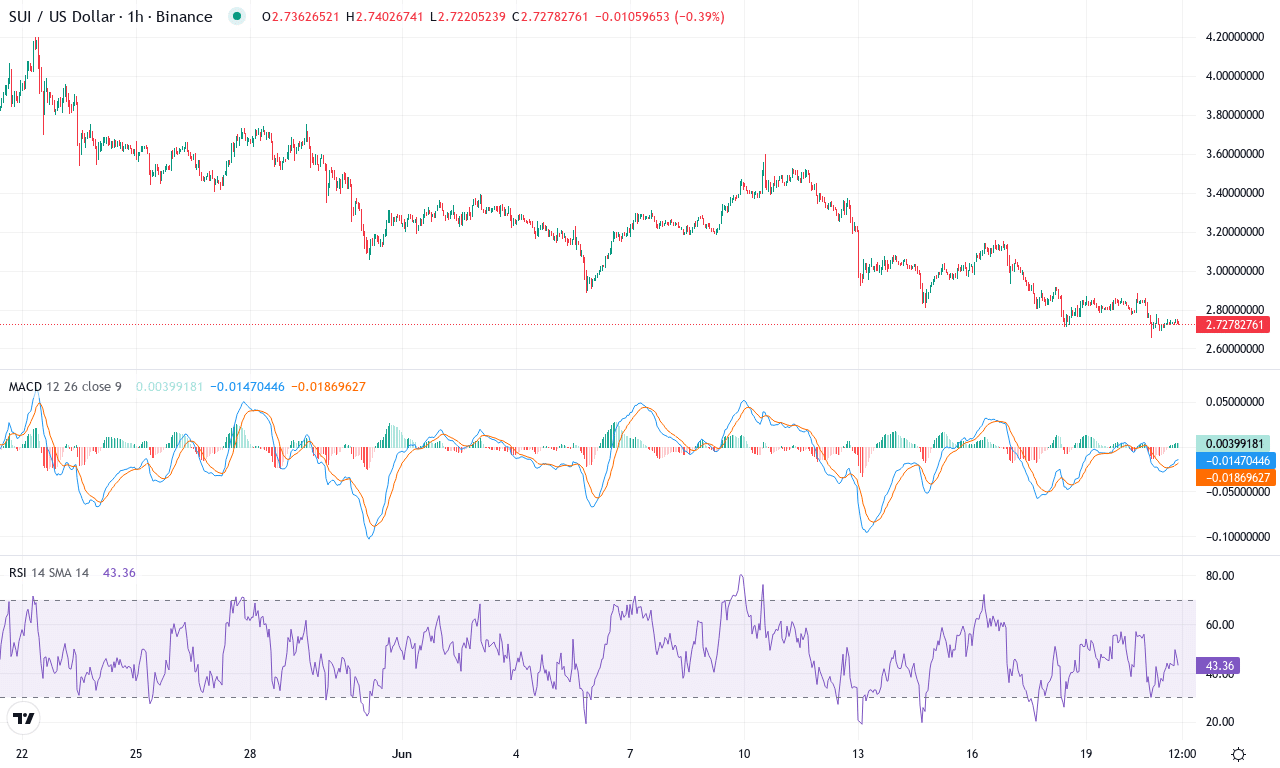
| Crypto | Close | 1W% | 1M% | RSI | ADX | MACD | CCI 20 | SUI(SUI) | $2.72 | -11.45% | -30.68% | 33.1 | 32.0 | -0.18 | -129.91 |
|---|
After a blistering start to the year, Sui (SUI) has been caught in a sharp reversal—down over 30% this month alone and sliding nearly 11.5% just in the last week. The pain is real: SUI recently bottomed near $2.65 before bouncing to $2.72, leaving the token a far cry from its spring highs above $3.95. If you’re feeling the whiplash, you’re not alone. Amidst a backdrop of prior triple-digit annual returns, such a steep correction signals sellers regaining control, with lingering doubts over whether bulls can muster a comeback in the near term. Macro momentum has clearly waned, and volatility threatens to cut both ways as SUI tests the nerves of both retail and institutional players.
Diving into the technicals, trend indicators flash a cautionary signal: ADX is elevated, while the negative directional line dominates—a clear flag that bearish momentum remains in charge. The weekly MACD line just flipped negative, reinforcing a loss of upward force, while oscillators like the Commodity Channel Index and Momentum are deep in negative territory, echoing oversold warnings but with little sign of eager buyers stepping in. SUI is now trading below all its major moving averages, with the 10-EMA and 20-EMA curling lower, suggesting little support from trend followers. Critical price action hovers just above the $2.70 support zone—should that level give way, I’d brace for a deeper selloff toward the $2.30s. On the flip side, a sustained reversal above $3.00 would invalidate the bearish thesis and hint at a squeeze higher, but for now, the path of least resistance remains to the downside. Volatility is on the rise, so risk management is paramount—remember, survival’s the name of the game when the tide turns this fast.
Chainlink (LINK) Price Analysis

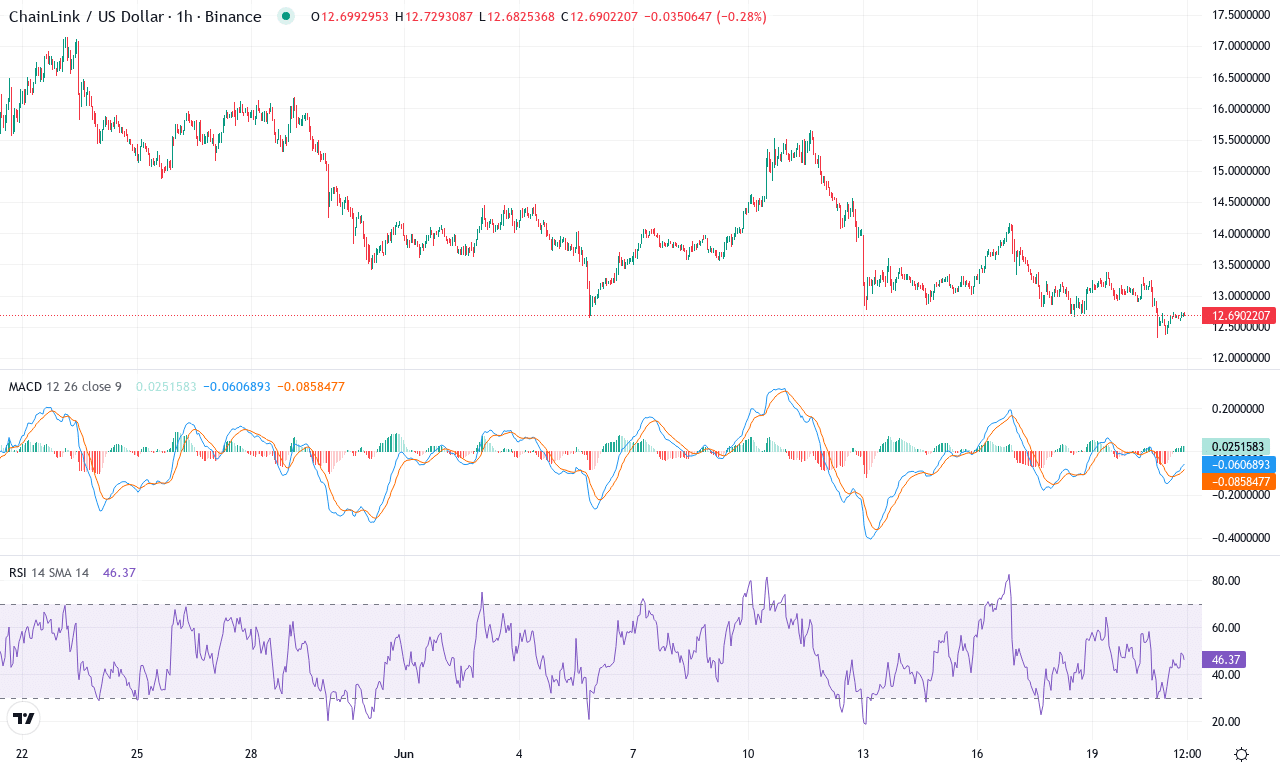
| Crypto | Close | 1W% | 1M% | RSI | ADX | MACD | CCI 20 | CHAINLINK(LINK) | $12.68 | -5.61% | -21.28% | 38.7 | 18.4 | -0.53 | -122.52 |
|---|
After a punishing month, Chainlink is struggling to shake off a steeper correction. The token tumbled nearly 21% over the past 30 days, dragging yearly losses further into double digits and erasing much of its early 2024 optimism. This week’s additional 5% slide has left LINK perched just above the recent $12.30 low, notably underperforming the broader digital asset market. Traders are facing a classic crisis of conviction as bullish momentum continues to wane; the technical outlook suggests bears are steadily regaining control. The price action is hovering around a critical inflection, and the mood on the desk? Frankly, anxious—it’s tough to stay patient when every bounce fades so quickly.
The technicals confirm the growing headwinds. Trend indicators point sharply lower: the negative directional index is widening, while the average directional index itself signals robust downside strength—a warning that bearish momentum is unlikely to dissipate anytime soon. The weekly MACD continues to accelerate south, joined by tired oscillators and a stagnant RSI sitting well below the midpoint, underscoring lackluster buying pressure. LINK is now trading beneath all major moving averages, including the pivotal 200-day EMA, capping any attempts at reversal rallies. With the price caught in limbo between $12.30 support and resistance near $15, all eyes are on these key levels. If sellers punch through this floor, risks extend to the $10 psychological zone—a spot where I’d brace for possible panic-driven liquidations. Conversely, recapturing $15 and sustaining a breakout above $16.90 would begin to invalidate the bearish thesis and invite short covering. For now, the path of least resistance leans lower—risk management is king.
Can Bulls Regain Control?
As XRP hovers at nearby support, SUI tests its previous floors, and LINK edges closer to critical downticks, the coming days hold pivotal potential. A failure to hold these levels may open doors to further declines, pressuring bulls to mount a defense. While bears currently dictate the tempo, the next market moves will reveal if bulls can pivot the narrative back in their favor.


