
Zcash, Pi Network, and Onyxcoin Teeter at Critical Support as Bulls and Bears Wrestle for Control
As Zcash teeters at critical support amid a volatile privacy coin sector, Pi Network and Onyxcoin are similarly caught in precarious positions, with bulls and bears engaged in a tense battle for control. Recent market movements have seen Zcash recover from a dramatic 19% tumble, only to find itself testing the mettle of bullish resolve ahead of June. Meanwhile, Pi Network’s price plunge underscores fading investor confidence, while Onyxcoin’s staggering 550% rally over six months faces a sharp correction. The technical signals across these assets hint at a critical juncture—will these coins reclaim lost ground or succumb to lingering bearish pressures? Let’s break down the technical setups to find out.
Zcash (ZEC) Price Analysis
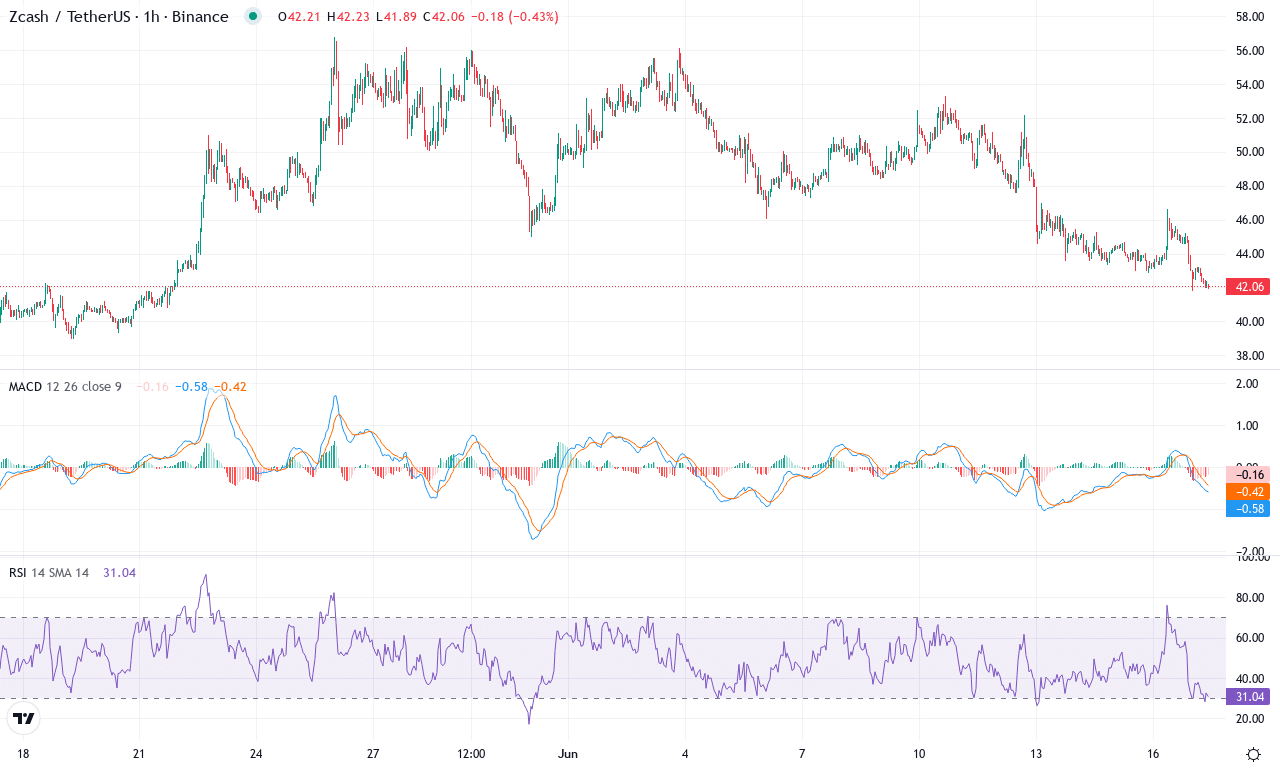
| Crypto | Close | 1W% | 1M% | RSI | ADX | MACD | CCI 20 | ZCASH(ZEC) | $41.99 | -18.61% | 3.76% | 38.5 | 21.0 | -0.72 | -166.94 |
|---|
After a brutal week that saw Zcash plunge nearly 19%, the coin is clinging to support just above $40, despite notching an impressive 26% gain over the last three months. This wild swing underscores the relentless volatility typical of the privacy coin sector, with ZEC in particular struggling to maintain bullish momentum into June. The sharp monthly bounce off its $39 low initially sparked hope for a broader trend reversal, but the current technical landscape reveals a market locked in a tug-of-war. Zcash is now trading right at its weekly close—a pivotal zone that could easily tip sentiment. For traders who thrive on volatility, Zcash’s impulsive price action promises no shortage of adrenaline, though the path ahead looks anything but smooth.
Diving into the technicals, ZEC is facing a precarious mix of signals. Oscillators suggest momentum is sputtering: the MACD has slipped into negative territory on the monthly view, confirming a loss of bullish conviction, yet the weekly setup hints at potential recovery should buyers return. With the RSI holding near neutral and trend indicators still elevated but declining, the technical outlook suggests Zcash is at a make-or-break level. The price is hovering just above a cluster of exponential moving averages, while classic support sits near $38—just below this threshold risks an extended fall toward the $24 zone. To reignite bullish momentum, bulls must decisively clear resistance in the $48–$50 band; a breakout there would open the door to $60 and beyond. Personally, I’m watching closely: if sellers slam ZEC through $38, I’ll be bracing for a steep correction. But if buyers can mount a rally and reclaim $50, that would invalidate the bearish thesis and set the stage for fireworks.
Pi Network (PI) Price Analysis
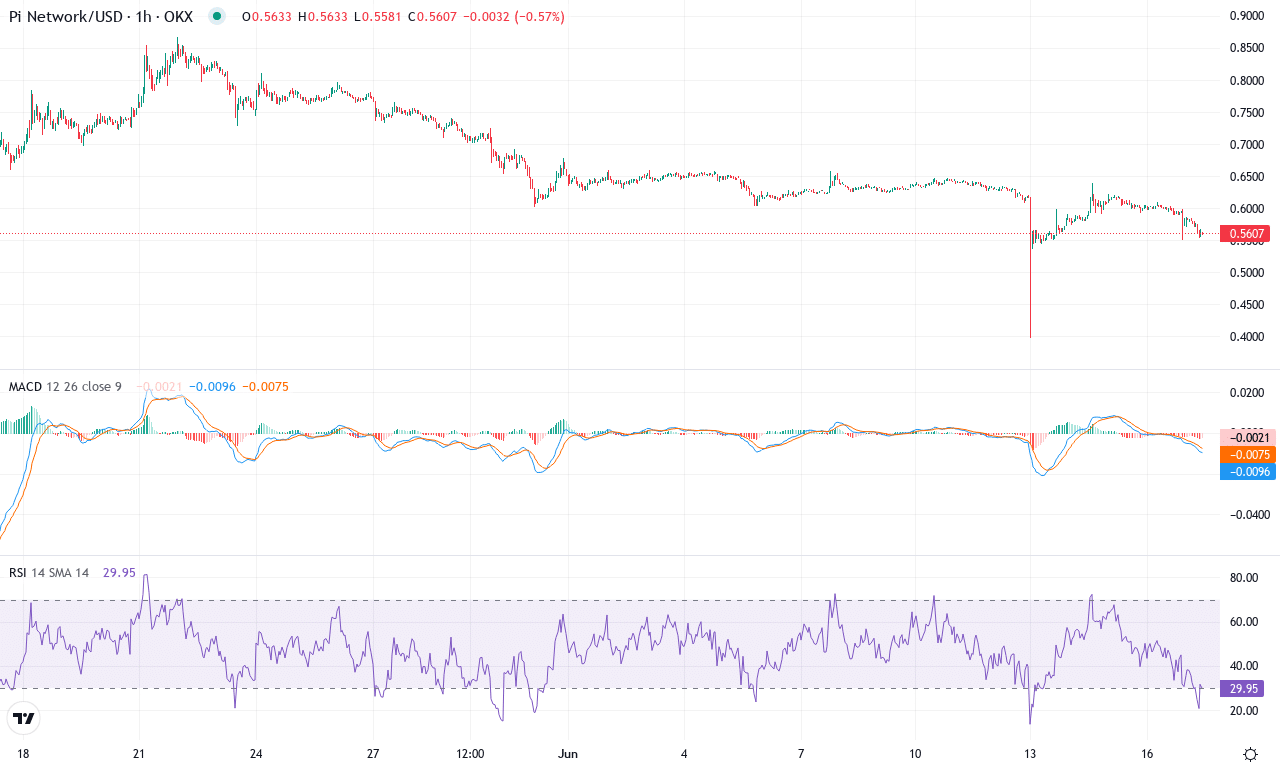
| Crypto | Close | 1W% | 1M% | RSI | ADX | MACD | CCI 20 | PI NETWORK(PI) | $0.56 | -12.06% | -18.97% | 34.1 | 21.4 | -0.04 | -154.90 |
|---|
After a turbulent month, Pi Network (PI) is showing signs of capitulation, with bears pressing their advantage. The token struggled to hold ground, plunging nearly 19% this month and languishing near $0.56—well off its $0.87 monthly high. The descent comes after a brutal three-month slide exceeding 50%, underscoring the loss of confidence and persistent selling pressure. Despite a brief sideways defense, PI’s technical outlook suggests bears retain control. The weekly chart paints a somber picture: oscillators are stuck in negative territory, momentum readings are depressed, and price action has decisively broken below all major moving averages. The overall tone is fraught with caution; if PI can’t reclaim lost territory soon, sentiment could sour further. Frankly, I’d be worried if this retracement deepens—panic selling isn’t out of the question in this kind of market climate.
Diving into the technicals, trend indicators confirm a dominant bearish momentum. A robust average directional index reflects strong trend strength, while negative directional movement stays in firm control—clear evidence that sellers have the upper hand. Both the MACD and its signal line are negative, with the histogram showing little sign of reversal—classic signals of a market entrenched in a downtrend. The RSI lingers in the low 30s, flagging an oversold condition, but without signs of bullish divergence, that exhaustion could persist. Crucially, price is hovering below its short- and long-term exponential moving averages, reinforcing the risk of an extended fall. Right now, $0.60 forms a tentative resistance, followed by more formidable selling interest near $0.72, while support sits just above June’s low at $0.40. If bulls fail to defend current levels, a break below $0.40 could trigger a steep correction toward uncharted territory. However, should buyers spark a bounce above $0.72, that could invalidate the bearish thesis and invite short covering—though as things stand, caution reigns supreme for PI traders.
Onyxcoin (XCN) Price Analysis
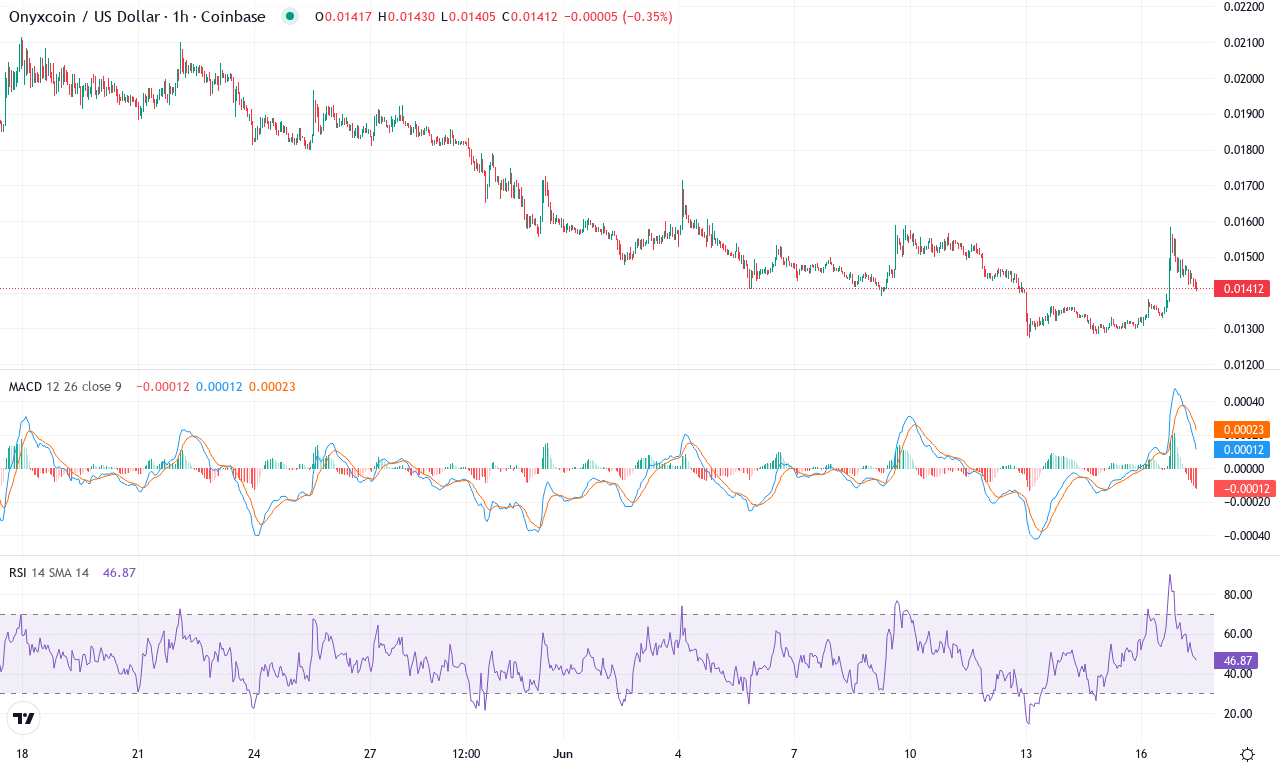
| Crypto | Close | 1W% | 1M% | RSI | ADX | MACD | CCI 20 | ONYXCOIN(XCN) | $0.01 | -9.38% | -32.76% | 40.6 | 17.2 | 0.00 | -49.24 |
|---|
After months of jaw-dropping appreciation—Onyxcoin is still up over 550% in the last six months—this token just posted a steep monthly correction, plunging nearly 33% and breaking the $0.015 psychological mark. Last week’s price action continued this volatility with another 9% slide, putting pressure on recent buyers and sparking whispers of a local top. It’s clear that bullish momentum has cooled drastically since the euphoric run earlier this year. Now, Onyxcoin is hovering close to its monthly lows, struggling to find its footing as profit-taking and risk-off sentiment take the stage. For traders like me, it’s a moment to watch closely: if bulls don’t defend current levels, risks of an extended fall loom large, and sentiment could turn outright bearish.
The technical outlook suggests momentum has faded sharply. Trend indicators remain robust overall, with the ADX still above 17, but they’re issuing a caution flag as selling pressure edges past the positive readings. The weekly MACD has just lost its upward bias, hinting that bears are regaining control—this is reinforced by oscillators signaling a loss of bullish momentum. RSI sits at a middling zone, well below overbought territory, while momentum and CCI are deep in negative territory, both aligning with the current corrective phase. Onyxcoin’s price has slipped below its fastest-moving averages and is now sitting just under the 10-period EMA—a classic early warning for trend reversals. Key short-term support lies at $0.0127, with a decisive breakdown here likely to provoke additional unwinding toward $0.011; conversely, a recovery above $0.0162 (the 30-day hull moving average) could breathe life back into the rally, with $0.018 acting as the next resistance. For now, all eyes are on this inflection point—I’ll be thrilled if buyers step up, but I’m bracing for further downside unless bulls mount a swift comeback.
Critical Crossroads Ahead
Zcash holds steady at its crucial support level, while Pi Network struggles to regain investor confidence. Onyxcoin’s recent surge now faces potential correction pressure. Each coin stands at a tipping point; further bullish momentum could see them reclaim recent losses, while failing to hold these levels may invite deeper corrections. Traders should watch for breakout confirmations to gauge the next move.