Zcash Teeters At Critical Support As Compound Bulls Eye Volatility-Driven Breakout
Zcash has staged an impressive run, soaring over 65% in three months, but recent volatility and profit-taking have pulled it back to a critical support zone. With a -7.7% dip just last week, traders are on edge as ZEC flirts with the psychological $47 level. Will the bulls muster enough momentum to fend off a potential dip towards $45, or are we facing an impending deeper correction? Let’s take a closer look at the signals behind the move.
Zcash (ZEC) Price Analysis
| Crypto | Close | 1W% | 1M% | RSI | ADX | MACD | CCI 20 |
|---|---|---|---|---|---|---|---|
| ZCASH(ZEC) | $50.25 | -7.70% | 11.13% | 53.6 | 25.8 | 1.75 | -23.77 |
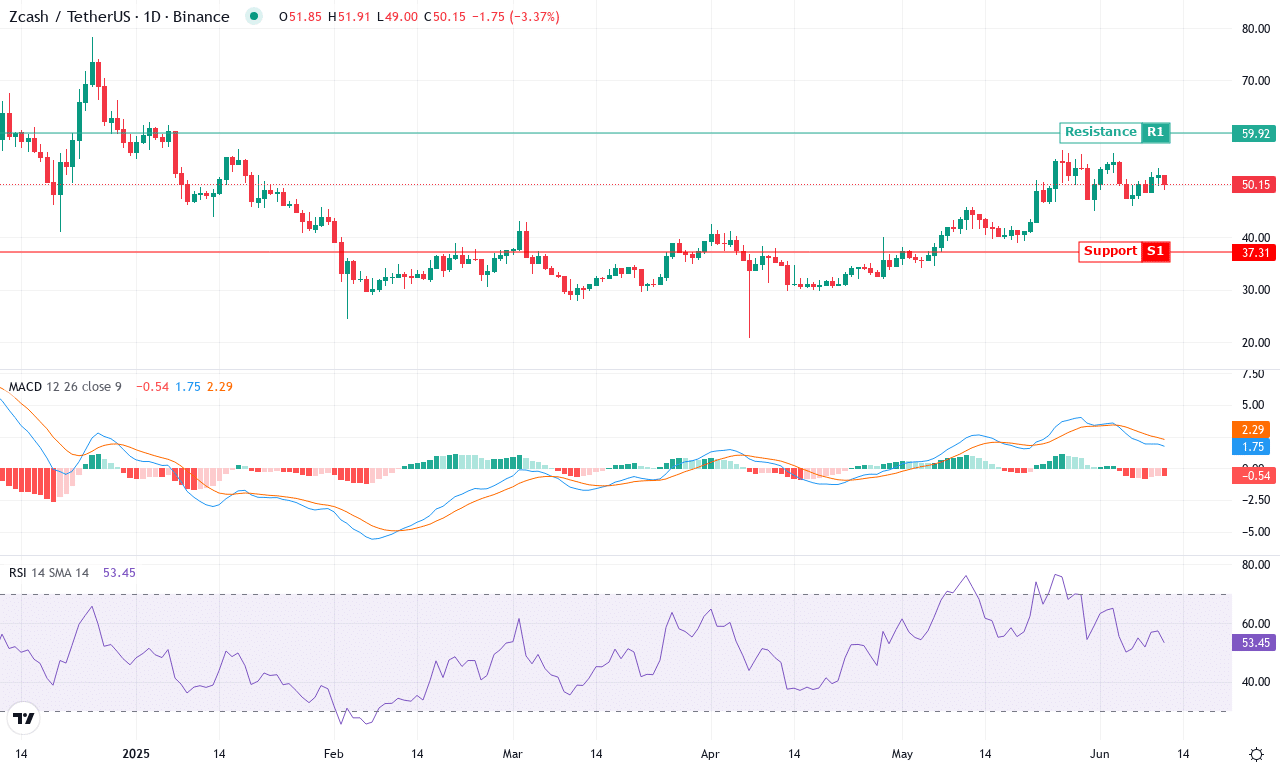
After a strong run earlier this quarter, Zcash (ZEC) is showing clear signs of cooling off, with the latest action highlighting pronounced volatility and profit-taking. ZEC surged over 65% in three months, but the last week delivered a sharp -7.7% pullback—enough to shake out weaker hands and remind us that no uptrend is invincible. The technical outlook suggests momentum is flagging: although the price bounced to a monthly high of $56.79 before retracing to $50.25, the drawdown has dragged ZEC dangerously close to a key psychological support zone near $47. If Zcash loses this footing, a steeper correction could drive prices toward the next support area around $45 or even $42, where long liquidations could spike. On the flipside, a convincing rebound above $55 might ignite the next bullish leg, reigniting enthusiasm among ZEC diehards—myself included.
Digging into the indicators, there’s a tug-of-war between fading bullish momentum and lingering upward trend signals. Trend indicators are still positive, but their strength is waning—the ADX is elevated, yet the gap between bullish and bearish directional indices is narrowing. The weekly MACD, once firmly bullish, is flattening out, signaling some exhaustion, while shorter-term oscillators such as RSI and stochastic measures hover in neutral territory. ZEC’s price is now sitting on top of the major moving averages (EMA10–EMA50), which cluster around $47–$50 and should act as near-term support. However, the breakdown from overbought CCI and a loss of Bollinger Band power imply sellers are regaining control. If ZEC can hold above the $47 level, a bounce back toward $56 and then $60 remains possible, but a decisive breach below $45 risks an extended fall. As usual, don’t forget: you’re never actually in the red until you hit that sell button.
Meanwhile, Compound has made a remarkable 31.6% rally in one week, standing on the cusp of a new volatility-driven breakout. As it consolidates below $59, the technical indicators are pointing towards increased bullish momentum despite a cautious backdrop. Will COMP break through its resistance at $68 to extend its rally, or will profit-taking halt its progress? Time to examine whether momentum can carry through.
Compound (COMP) Price Analysis
| Crypto | Close | 1W% | 1M% | RSI | ADX | MACD | CCI 20 |
|---|---|---|---|---|---|---|---|
| COMPOUND(COMP) | $58.88 | 31.60% | 22.64% | 73.0 | 30.3 | 2.93 | 273.07 |
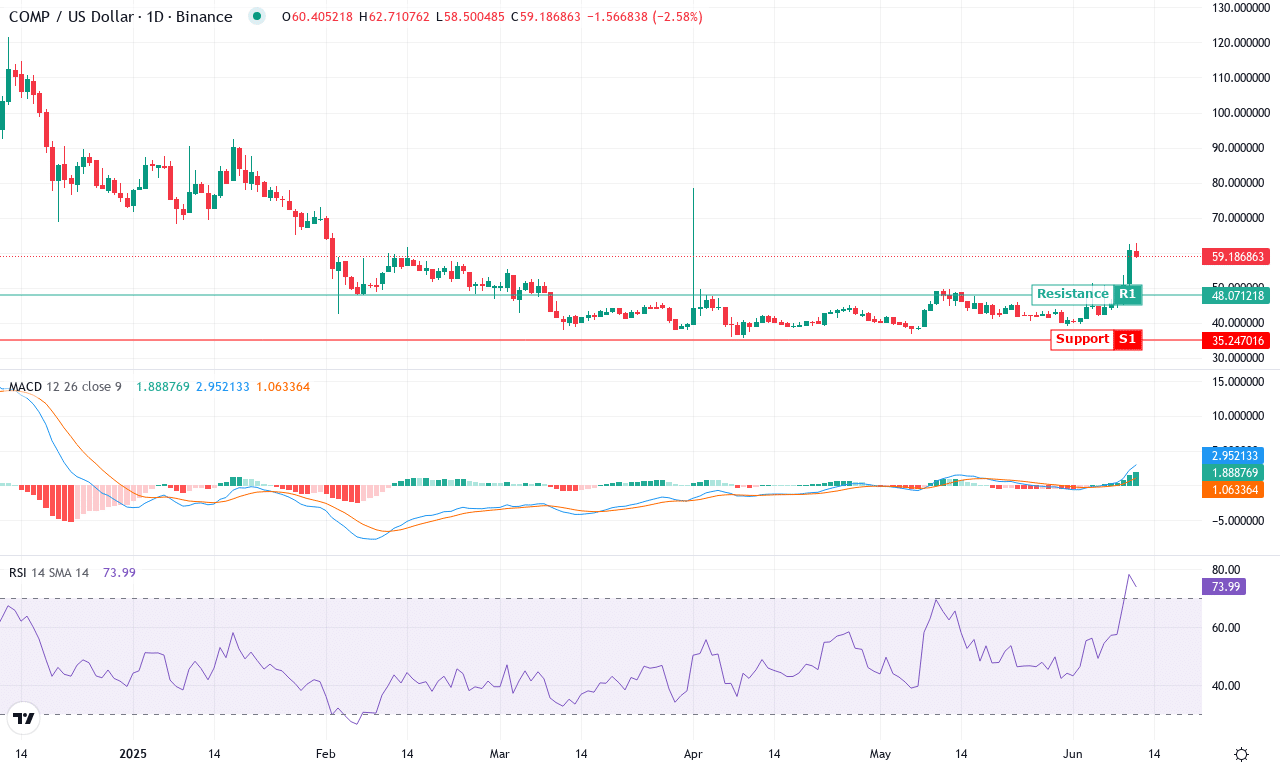
After a blistering 31.6% rally in just one week and a 22.6% monthly surge, Compound (COMP) is undeniably back on traders’ radar. The rebound from a monthly low near $39 has been dramatic, with COMP now consolidating just below $59—flirting with its short-term moving averages and preparing for its next decisive move. This momentum isn’t isolated; a strong three-month gain of over 40% reinforces that bulls are regaining control, even as the backdrop of a 6-month slump lingers in collective memory. With both volume and volatility on the rise, COMP’s technical outlook suggests we might be bracing for a volatility surge or, dare I say, another steep breakout. Personally, watching a coin bounce more than 50% off the lows always gets my adrenaline up—especially as institutional inflows start picking up in DeFi sector leaders.
Delving into the charts, trend indicators are flashing clear signals—directional strength is robust, and positive directional momentum is outpacing the bears. The weekly MACD is ticking higher, hinting at accelerating bullish momentum, while oscillators like RSI are hovering in the 70s, brushing overbought territory but not yet issuing an outright sell signal. Compound is holding above its 10- and 20-period exponential moving averages, bolstering short-term confidence, while pivotal resistance looms at $68. If bulls clear that wall, the next technical target aligns with the recent swing high near $73, with room for secondary pushes toward $85 if buyer appetite stays strong. On the flip side, failure to sustain above $55 could invite rapid profit-taking and a pullback toward the $50–$46 support band, risking an extended fall back toward the VWMA and longer-term moving averages. For my part, I’m keeping a close eye on COMP here—the winds of volatility are swirling, and this dance near resistance is where major reversals or breakouts are born.
Potential for Reversal or Continued Momentum?
Zcash trades precariously at the $47 support, a pivotal line that could determine a slide to $45 if breached. Meanwhile, Compound’s consolidation below $59 hints at underlying strength, yet it must clear $68 for rally continuation. These scenarios place both assets at critical junctures, urging traders to watch for signs of sustained volume and momentum shifts.